EMI regulations are in place throughout the world to provide improved reliability and safety for users of electrical and electronic equipment. To ensure compliance with these regulations, many companies employ the services of a specialized test facility to perform the actual compliance tests required for EMI certification. The test facility might belong to an outside company (a "test house") or to an in-house EMC department.
A great deal of time and effort goes into the design of today's products to minimize their EMI signatures. Most engineers employ good design practices to minimize the potential for EMI problems. It is common today to perform pre-compliance measurements during the design and prototyping stages to identify and address potential EMI issues before the product is sent out for compliance testing.These techniques reduce the risk that the product will fail the final full compliance at the test house.
Performing basic pre-compliance testing can help minimize your time and expense at the compliance test house.Performing pre-compliance testing can help you catch out of specification conditions before you send your product for formal testing. If you have already been to a test house and your product failed the emissions test, testing in your own lab gives you the time to methodically isolate your problem areas and apply different corrections.
With the introduction of the Tektronix USB based Real Time Spectrum Analyzers, such as RSA306, RSA306B, RSA600A or RSA500A, pre-compliance testing has never been easier or more cost effective. This application note provides an overview of EMI compliance testing, pre-compliance testing, and the measurement regulations.Test setups using the RSA306 and similar low cost products are used to perform both radiated and conducted emission measurements that can help you minimize both your expense and schedule for getting your products EMI certified.
Compliance Testing
Compliance testing requires methods, equipment and measurement sites in compliance with international standards.Compliance tests are commonly done as part of the design qualification prior to production of a device. Compliance testing is exhaustive and time consuming, and a failure in EMC at this stage of product development can cause expensive re-design and product introduction delays.
The term Radiated Emissions refers to both the intentional and unintentional release of electromagnetic energy from an electronic device. To address this concern, a radiated test is performed to ensure that emissions emanating from the DUT comply with the applicable limits.
The term Conducted Emission refers to the mechanism that enables electromagnetic energy to be created in an electronic device and coupled to its AC power cord. Similar to radiated emissions, the allowable conducted emissions from electronic devices are controlled by different regulatory agencies.
Unless you are fortunate enough to have an accredited inhouse full compliance laboratory in your company, the best choice is to involve a third-party compliance lab at the design stage and then follow through with testing of your product at the lab. There are many EMC labs around the world. In the United States, the FCC maintains a list of laboratories certified for compliance testing.
The full compliance test in a certificated lab is expensive with costs ranging from $1,000 to $3,000 per day. Even if you have your own internal full compliance lab, the time to perform compliance test is significant. Failure of these tests can mean some level of costly and time consuming design if rework is required. It is best to do as much pre-compliance verification as practical to reduce the risk of a failure during compliance testing.
Compliance Test Facilities
Some of the cost drivers for compliance testing are the facilities and equipment needed to perform the testing.Formal testing requires:
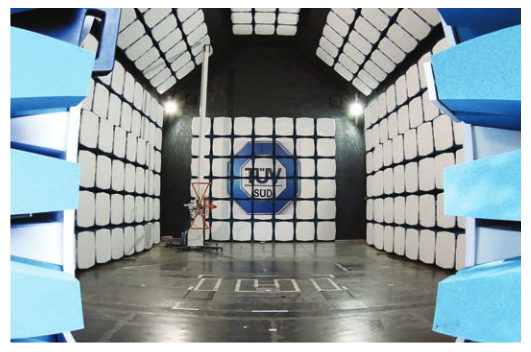
- An EMC lab with large anechoic test chamber (Figure 1)
- An EMI receiver with Quasi-peak detector and preamplifier, that can test up to the tenth harmonic or to 40 GHz
- Mast and 360° Turn table
- EMI software controlling the test equipment like masts, turn tables, EMI Receiver and report generator
- Antennas
- Line impedance stabilization network (LISN) and Transient Limiter (Only for AC Conducted measurements if necessary)
Results from a Certified Test Lab
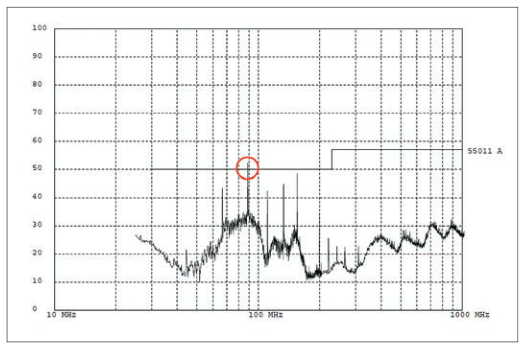
The EMI test house makes their radiated measurements in a calibrated RF chamber and reports the results as a measure of field strength. This example report (Figure 2) indicates that there is a single peak which is above the limit for this specific standard. Normally in the report you will also receive the information in tabular format (Figure 3).
The report in Figure 3 shows the test frequency, measured amplitude, calibrated correction factors, and adjusted field strength. The adjusted field strength is compared to the specification to determine the margin, or excess.

Pre-Compliance Testing
In the EMI world, different equipment and techniques are used at different stages of design and qualification. At the early stages of development, design-for-EMC techniques are combined with diagnostics to produce low compliance signatures and low susceptibility to both external and internal interference. Pre-compliance testing may be used to catch compliance problems early and greatly improve the probability of successful first pass of full EMC compliance testing without additional re-design. If early compliance testing has identified problem areas, pre-compliance testing offers a fast, low cost method for evaluating modifications to your design.
Pre-compliance testing is not required to conform to international standards; the goal is to uncover potential problems and reduce risk of failure at the expensive compliance test stage. The equipment used can be noncompliant and have lower accuracy and dynamic range than compliant receivers if sufficient margin is applied to the test results. Pre-compliance testing requires:
- Spectrum analyzer with quasi-peak detector
- Preamplifier (optional)
- Antenna with non-metallic stand for radiated emissions
- Line impedance stabilization network (LISN) for conducted
- Power limiter for conducted
- Near field probes for diagnostics (optional)
Pre-compliance testing may be done in a certified lab using fast measurement techniques intended to give a "quick look" at problem areas, or done at a temporary site by engineering personnel.
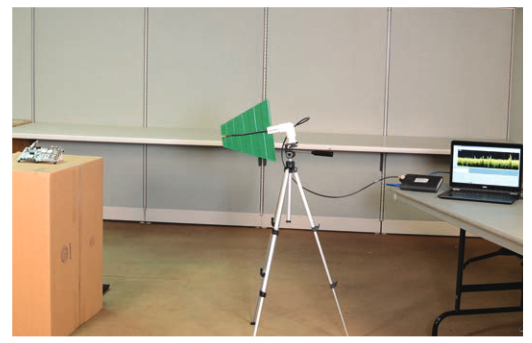
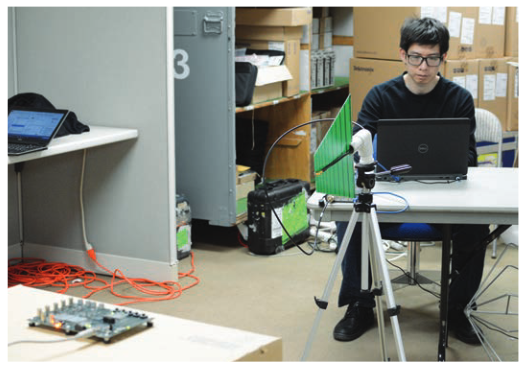
When selecting a test site it is best to pick a location that will minimize external signal sources. Rural areas, conference rooms or basements are good because they minimize signals that might mask the DUT emission levels you are trying to measure (Figure 4).
General-purpose spectrum analyzers, such as the Tektronix RSA306, that offer general purpose filters and detectors are often employed in pre-compliance. They are measurement tools that often are already used in the design process, so little additional capital expense may be required.
Spectrum Analyzer Settings for EMI Measurements
Spectrum analyzers used for EMI measurement have a defined receiver bandwidth, method of signal detection, and method of averaging results to achieve signal levels.In the case of many commercial EMI measurements, these measurement elements are defined by the Comité International Special des Perturbations Radioélectriques (CISPR), a technical organization within the International Electrotechnical Commission (IEC), an international standards body. Other standards and certification bodies, such as TELEC in Japan, also have requirements for measurement methods and certification techniques. In the US, the Department of Defense has developed the MIL-STD 461G with special requirements for military equipment.
Some other requirements are not specified by the standards, and are only subject to local geographic regulations. Operation in countries within defined regulatory domains may be subject to additional regulations. Implementers need to refer to the country regulatory sources for further information. Table 1 lists some of the current regulatory bodies and the countries in which they have jurisdiction.
| Country | Approval Regulatory Bodies |
| United States | Industry Canada (IC) |
| Canada | Federal Communications Commission (FCC) |
| Japan | Ministry of Internal Affairs and Communications (MIC)) |
| China | Ministry of Industry and Information Technology (MIIT) |
Table 1. Examples of regulatory bodies
Resolution Bandwidth (RBW)
The bandwidth of the measurement is defined by a receiver bandwidth shape or a resolution bandwidth (RBW) filter in the case of a spectrum analyzer. The bandwidths used are representative of the perceived threats within the spectrum, and the bandwidths vary with the receive frequency.
The level measured by a receiver or spectrum analyzer of any non-continuous signal will depend upon the measurement bandwidth used. To achieve consistent results, regulatory agencies have defined the bandwidth and shape of the filters used in compliance measurements. Filter bandwidths specified by CISPR for peak, RMS, and average detectors are shown in Table 2. The American National Standards Institute (ANSI) and MIL-STD-461 bandwidths are shown in Tables 3 and 4, respectively.
| Frequency Range | Bandwidth (6 dB) | Reference BW |
| 9 kHz to 150 kHz (Band A) | 100 Hz to 300 Hz | 200 Hz |
| 0.15 MHz to 30 MHz (Band B) | 8 kHz to 10 kHz | 9 kHz |
| 30 MHz to 1000 MHz (Bands C and D) | 100 kHz to 500 kHz | 120 kHz |
| 1 GHz to 18 GHz (Band E) | 300 kHz to 2 MHz | 1 MHz |
Table 2. Measurement Bandwidth versus Frequency specified by CISPR 16-1-1.
| Frequency Range | Bandwidth (6 dB) |
| 10 Hz-20 kHz | 10, 100, and 1000 Hz |
| 10-150 kHz | 1 and 10 kHz |
| 150 kHz-30 MHz | 1 and 10 kHz |
| 30 MHz-1 GHz | 10 and 100 kHz |
| 1-40 GHz | 0.1, 1.0 and 10 MHz |
Table 3.Bandwidths versus frequency specified for peak, average and RMS detectors by ANSI C63.2.
| Frequency Range | Bandwidth (6 dB) |
| 30 Hz - 1 kHz | 10 Hz |
| 1 kHz - 10 kHz | 100 Hz |
| 10 kHz-150 kHz | 1 kHz |
| 150 kHz-30 MHz | 10 kHz |
| 30 MH-1 GHz | 100 kHz |
| Above 1 GHz | 1 MHz |
Table 4. Bandwidths versus Frequency specified by Mil-STD-461.
Figure 5 shows the differences in filter shape for 3-dB vs 6-dB filters. Both filter shapes are Gaussian, but the width is different. The measurement filter bandwidth is specified at some amount of power down from the peak. So a 100 kHz 3-dB filter is described by the yellow trace in Figure 5, where the 100 kHz width occurs 3 dB down from the peak. The 100 kHz 6-dB filter has the same width, but is specified 6 dB down from the peak.
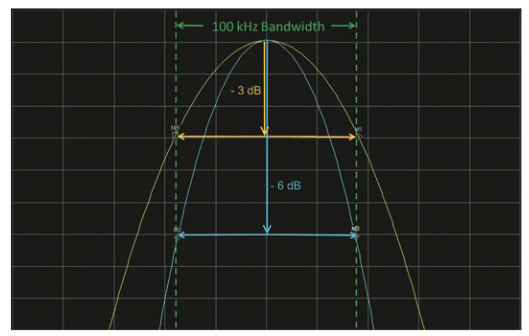
RBW filters are generally specified at -3 dB for most spectrum analyzer measurements outside of EMI testing.However, 6-dB filters are used for most EMI measurements,and CISPR16-1-1, ANSI, and MIL-STD 461 all specify 6-dB filters.
This is important because measurements will differ with filter shape. While the peaks of the signals should be the same level for a given 3-dB or 6-dB filter, the measured noise would be lower for the same RBW setting between a 3-dB and a 6-dB filter.
Detection Methods
A detector calculates a single point that represents the signal over a defined sampling interval. Detection methods can calculate the positive or negative peak, the RMS or average value of voltage, or the Quasi-Peak (QP) value. The compliance labs use quasi-peak (QP) detectors for the full compliance test. The EMI department or the external labs typically begin their testing by performing a scan using simple peak detectors to find problem areas that exceed or are close to the specified limits. For signals that approach or exceed the limits, they perform QP measurements. The QP detector is a special detection method defined by CISPR 16-1-1 standards.The QP detector serves to detect the weighted peak value (quasi-peak) of the envelope of a signal. It weights signals depending upon their duration and repetition rate. Signals that occur more frequently or last longer will result in a higher QP measurement than infrequent, short impulses.
An example of peak and QP detection is seen in Figure 6.Here, a signal with an 8 μs pulse width and 10 ms repetition rate is seen in both peak and QP detection. The resultant QP value is 10.1 dB lower than the peak value.
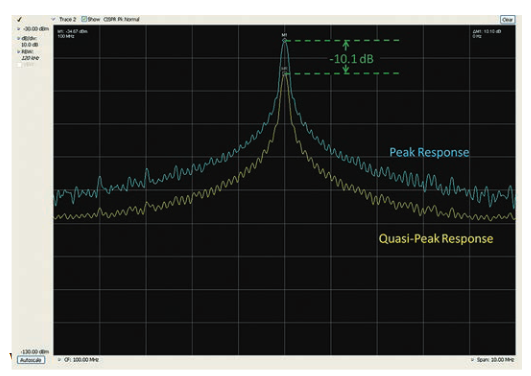
A good rule to remember is QP will always be less than or equal to peak detect, never larger. The RSA306 offers average and quasi peak detection to do your EMI troubleshooting diagnostics. You can use the same approach used by the lab and start with a fast peak scan of the device to verify you find the same issues the lab reported. Then you can implement fixes and validate fixes with a localized quasi-peak detection.
Video Filters
Video filters are specified in some EMI measurements and were the original method used in spectrum analyzers to reduce the effects of noise variations in measurements. The name video filter derives from the original implementation,when low-pass filters were placed between the detected output and the Y-axis analog drive input of the CRT on the spectrum analyzer. RTSAs and some modern spectrum analyzers use digital techniques to achieve this smoothing of the noise on the signal. In most EMI measurement cases,video filters are specified to be either off, or the video filter is specified to be at least 3 times greater than the specified RBW of the measurement.
Intentional Radiator Measurements
As the wireless revolution enters its next phase of deployment,there is a shift to add wireless capabilities on a wide variety of non-traditional products like thermostats, coffee makers,and even toothbrushes. One challenging part of this revolution is that it demands that product manufacturers learn how to properly add this new wireless capability to their products.From an EMI perspective, it will require additional intentional radiator testing. An intentional radiator is a device that broadcasts radio energy (not infrared or ultrasonic energy) to perform its function. Intentional radiation is produced by devices like:
- Cell phones
- Citizen's band (CB) radios
- Walkie-talkies
- Wireless connections
- Bluetooth devices
- Short range broadcast equipment
- Wireless key-access systems
- Active near field communications (NFC) and radio frequency identification (RFID) systems
Clearly radio waves are needed for the energy transfer.These devices intentionally use the radio spectrum and therefore always require FCC or other equivalent equipment authorization. Devices that are intentional radiators are also subject to unintentional testing requirements. Emissions frequencies other than those the device is designed to use can occur because of internal circuitry
When selecting a spectrum analyzer for this type of testing,it is important to select an instrument that can capture at least the third harmonic (if not more) of the radiated signals being generated within the device. The test setup for an intentional radiator is the same as the radiated emissions setup shown before. However, in this case, the frequencies of interest are limited to the radiated frequencies and frequency masks defined by the specifications, such as WiFi, Bluetooth, etc.Tektronix has an application note that focuses on the details of this measurement using a WiFi example.
Case Study: Radiated Emission Measurements
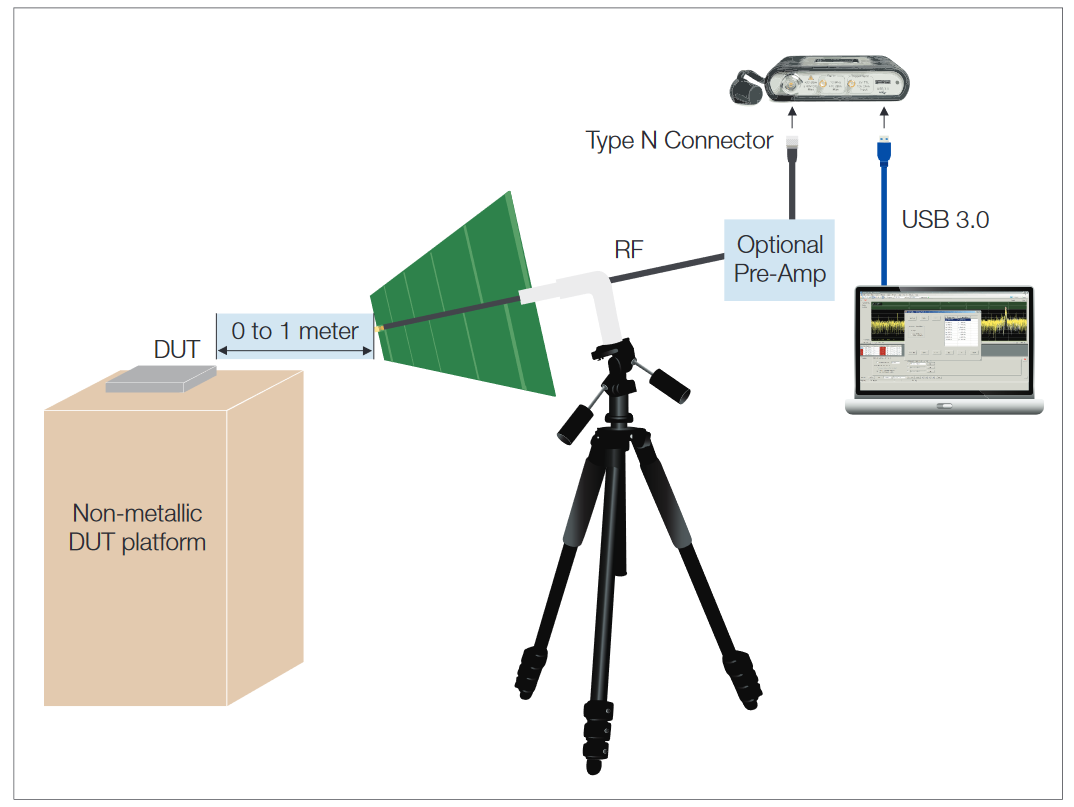
In our pre-compliance testing we used a distance of both one meter and a few centimeters. Reducing the distance between the DUT and the test antenna increases the ratio of the DUT signal strength to RF background noise.Unfortunately, near field results do not translate directly into the far field tests used in EMI compliance testing, so one has to be careful about drawing conclusions. (See the sidebar, "Near Field vs. Far Field Measurements".) Adding a pre-amplifier is another good way to boost the relative DUT signal levels.Figure 8 (on page 8) shows a block diagram of our setup.
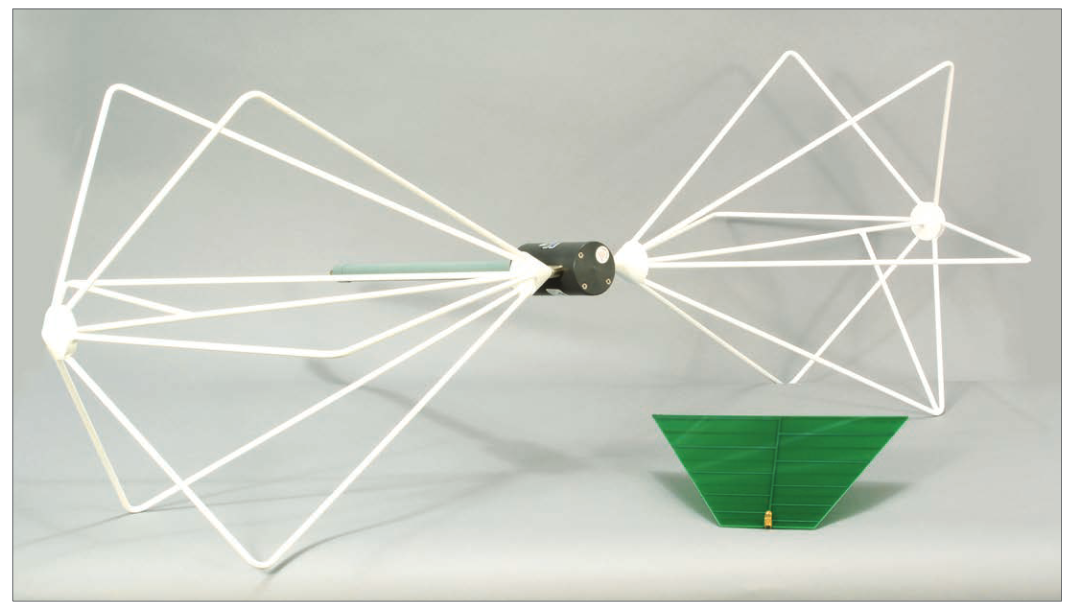
Selecting Antennas
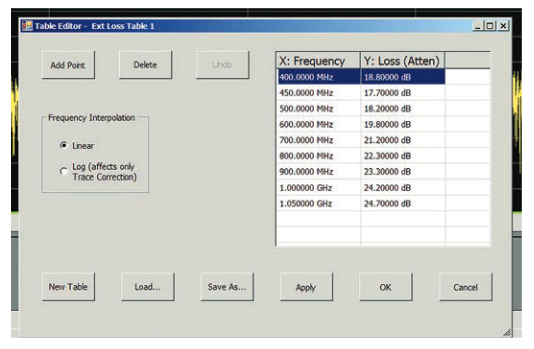
For our measurements we used three very low cost PC board log periodic antennas2 and a biconical antenna.These antennas were mounted on a tripod for easy placement.The Antenna Factors (AF) and cable loss can be input into the RSA306 for field strength correction (Figure 10). A biconical antenna was used for the 20 to 200 MHz frequencies. The longer 20 to 200 MHz wavelengths require a larger antenna,and the background noise may also be an issue as it includes many radio broadcast frequencies.
Characterizing Your Environment and Test Results
After inputting the antenna correction factors and cable loss to the RSA306, turn on the peak detectors and set the limit lines. The limit lines were adjusted to adapt to our testing environment.
Prior to turning on your DUT it is important to evaluate and characterize your test environment. Is there enough signal room between the limit line and your ambient noise floor? Are there known signals that can be reduced? Do you need to move your test set up to a quieter environment?
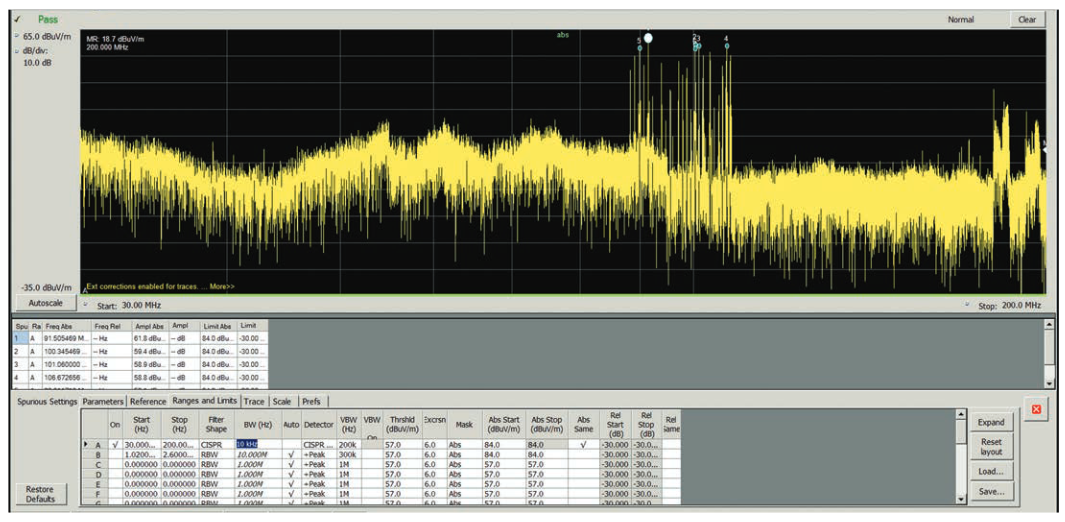
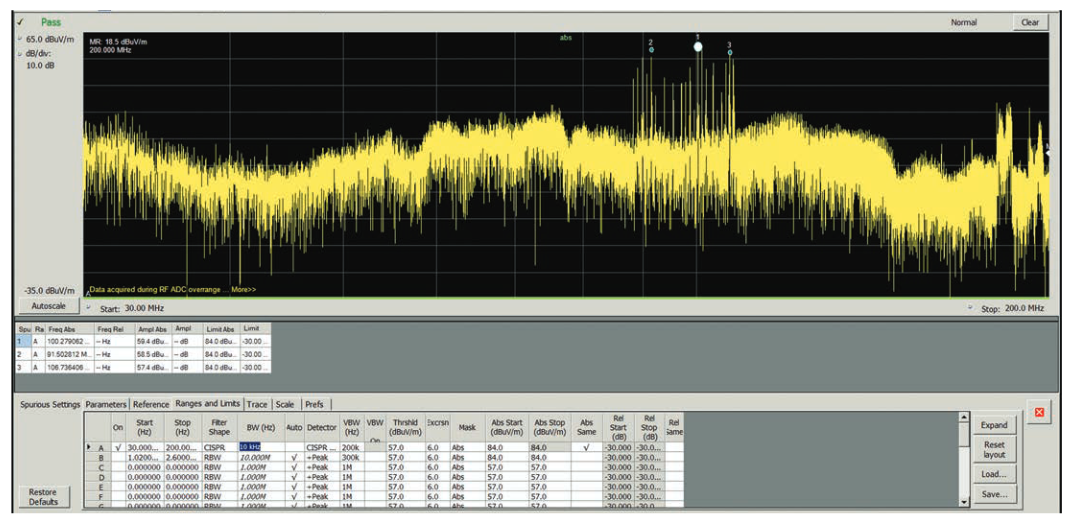
Once you are satisfied with your background noise, turn on the power to your DUT. The differences between the two measurements are the emissions from the DUT (Figure 11b).
For our testing, we used a Tektronix WiFi demo board that had already been through EMI compliance testing, so there were no failures to detect. The good news is that if you have setup your testing correctly and nothing comes close to the limit line,it may mean that you are ready for compliance testing.
If problems are uncovered at this stage, further diagnosis and design modifications may be required. The features available on the RSA306 allow for both pre-compliance measurements and diagnostics. Problem signals may be identified by engineers familiar with the DUT design. Near field probing tools may also be useful and are discussed in a later section.
Near Field vs. Far Field Measurements
In a full compliance lab, EMI receivers and well-calibrated antennas are used to test the electronic devices over a distance of 3 or 10 meters. In other words, the measurements might be done in the far field. These test chambers are designed to eliminate or greatly reduce all the unwanted RF signals so that only the DUT's EMI signals are measured.
While every effort needs to be taken to ensure that the RF background noise is minimized for your pre-compliance testing, the background noise may still be significant.Reducing the distance between the test antenna and the DUT boosts the signal level of the DUT relative to the RF background.
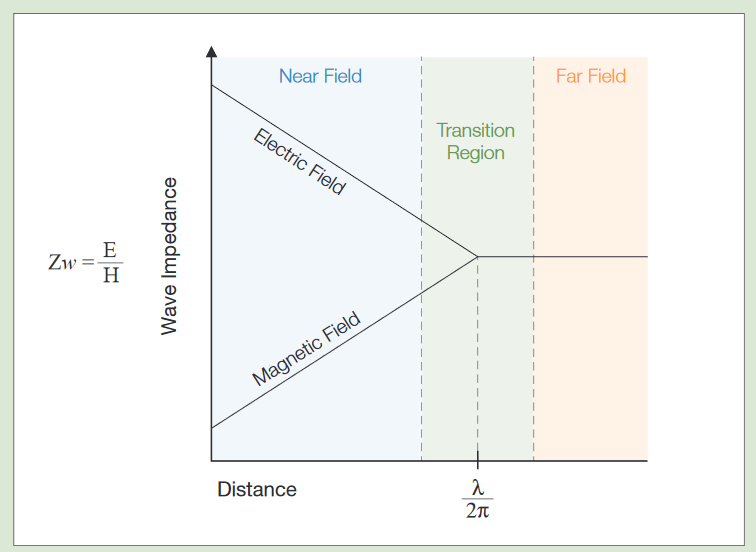
Figure 12 shows the behavior of wave impedance in the near and far fields, and the transition zone between them.We can see that in the near field region fields can range from predominantly magnetic to predominantly electric wave impedance. Near field measurements are used for troubleshooting, since they allow one to pinpoint sources of energy and they may be performed without the need for a special test site.
However compliance testing is performed in the far field and predicting far field energy levels from near field measurements can be complicated because the strength of the far field signal is dependent not only on the strength of the source, but also the radiating mechanism as well as any shielding or filtering that may be in place. As a rule of thumb we must remember that we if are able to observe a signal in the far field then we should be able to see the same signal in the near field. However it is possible to observe a signal in the near field and not see the same in the far field.
Case Study: Conducted Emission Measurements
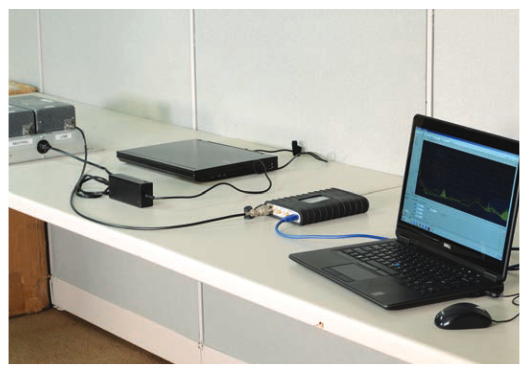
Figure 13 shows our pre-compliance setup for conducted emissions testing. The device under test is a universal AC/DC power adapter for a laptop computer.
LISN (Line Impedance Stabilization Network)
Caution! It is critical that the spectrum analyzer input is disconnected from the LISN prior to unplugging the source power to the LISN! The discharge levels from the LISN can damage the front end of the spectrum analyzer.
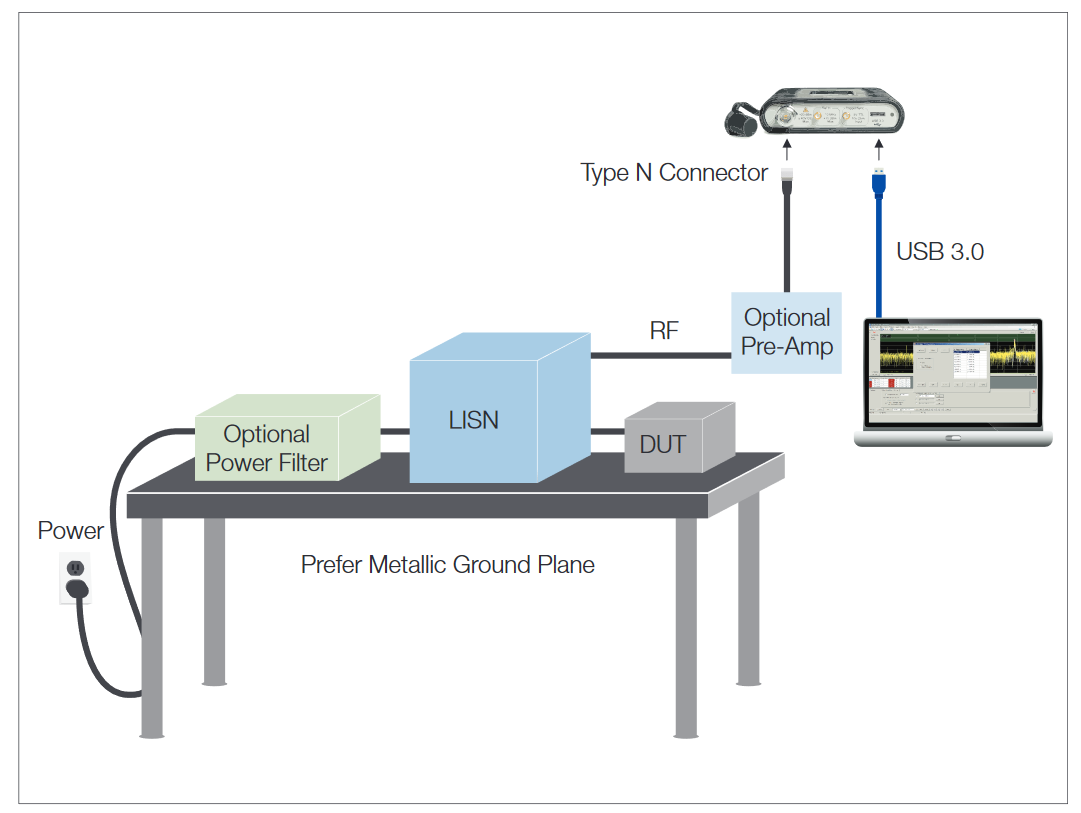
For conducted measurement instead of antennas you use a LISN (line impedance stabilization network). A LISN3 is a low-pass filter which is placed between an ac or dc power source and the DUT to create a known impedance and to provide an RF noise measurement port. It also isolates the unwanted RF signals from the power source. Again, adding a pre-amplifier is a good way to boost the relative DUT signal levels. Figure 14 (on page 13) shows a block diagram of our setup.
Note that the interference being conducted on a 60 or 50 Hz power supply can also be an issue for some. While most of the conducted EMI tests specify a measured frequency range of 9 kHz to 1 GHz, it can be useful to measure the signals at lower frequencies when the need arises. For low frequency measurements, RSA5100 Series real time spectrum analyzers are a good choice since they can cover frequencies down to the sub-hertz frequency ranges.
For best conducted EMI measurements, it is advisable to use 2 LISN's: one for a defined impedance to the DUT, and one to go to the spectrum analyzer or receiver. However, one LISN is better than none, but 2 is best.
Power Filter
For conducted measurements the background noise comes from the power source. While the LISN will provide some isolation, many times you will need additional power filtering.For our measurements, the noise from our building power dominated our results. By adding a power filter4 we were able to reduce the incoming noise to a sufficient level for making our conducted measurements.
Characterizing Your Environment and Test Results
First we input the LISN correction factors to the RSA306,turn on the peak detectors and set the limit lines. Again,prior to turning on your DUT it is important to evaluate and characterize your test environment. Is there enough room between the limit line and your noise floor? Do you need to add a power filter?
Once you are satisfied with your background noise, turn on the power to your DUT and attach the LISN output to the spectrum analyzer, in that order. The differences between the two measurements are from the DUT (Figure 15).
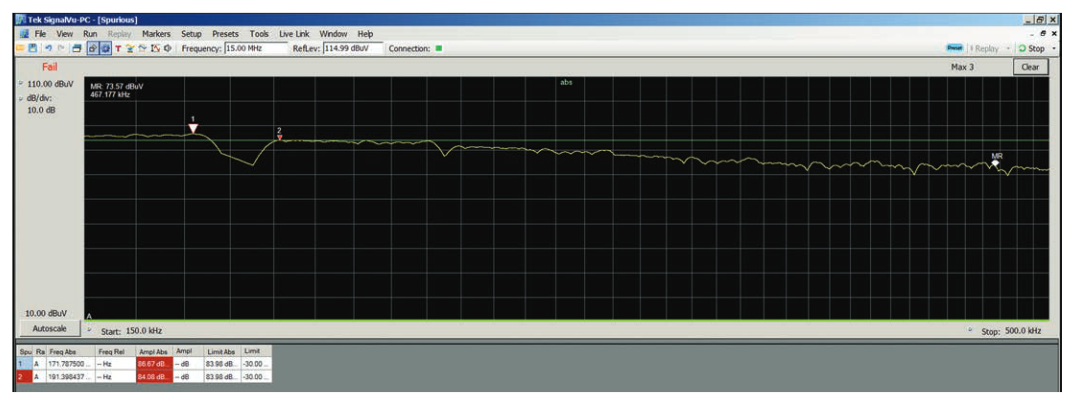
For the conducted measurements our DUT was a very low cost laptop power supply purchased over the internet. We used a spare laptop as a load for the power supply. In this case we were able to see a failure. Figure 15 shows the DUT conducted emission going above the limit at approximately 172 Hz. The features available on the RSA306 allow for pre-compliance measurements and diagnostics. Problem signals may be identified by engineers familiar with the DUT design. Again near field probing tools may be useful. If you have setup your tests correctly and nothing comes close to the limit line, it may mean that you are ready for your compliance testing.
Near Field Tools for Debugging
In essence, the far field test can accurately tell whether the product passes or fails as a whole but cannot pinpoint the source of a problem. Using only the far-field test, one cannot isolate problems down to specific components or locations,like too much RF energy "leaking" from an opening in a metal enclosure or help identify a cable radiating too much RF energy. The near-field test is a good way to locate such emission sources and is typically performed using a spectrum analyzer and near-field probe.
Near-field Probes for EMI are electromagnetic pickups used to capture either the electric (E) or magnetic (H) field at the area of interest and are used with the spectrum analyzer.Manufacturers provide kits of probes that offer the best compromise between size, sensitivity and frequency range,and you may need all the sizes in your toolkit to solve your problem. Selection between an H-field or E-field probe may be driven by location of a signal in your design, or by the nature of its source (voltage or current). For example, the presence of a metal shield may suppress the E-field, making it necessary to use an H-field probe for the application. Near-field probes must be used to either pick up the signal near the device under test. For further information Tektronix has an application note that focuses on troubleshooting EMI problems using near field probes.
Conclusion
Failing an EMI compliance test is expensive and can put a product development schedule at risk. However, setting up your own pre-compliance testing can help you isolate any problem areas and fix them before you go to the complaint test house. The Tektronix RSA306 offers a new low cost pre-compliance capability that will help you minimize both your expense and schedule in getting your products EMI certified.
Find more valuable resources at TEK.COM
Copyright © Tektronix. All rights reserved. Tektronix products are covered by U.S. and foreign patents, issu ed and pending. Information in this publication supersedes that in all previously published material. Specification and price change privileges reserved. TEKTRONIX and TEK are registered trademarks of Tektronix, Inc. All other trade names referenced are the service marks, trademarks or registered trademarks of their respective companies.
01/16 37A-60141-1