Engineers designing or validating the 1000BASE-T Ethernet physical layer on their products need to perform a wide range of tests, quickly, reliably and efficiently. This application note describes the tests that ensure validation, the challenges faced while testing multi-level signals, and how oscilloscoperesident test software enables significant efficiency improvements with its wide range of tests, including return loss, fast validation cycles, and high reliability.
The Basics of 1000BASE-T Testing
Popularly known as Gigabit Ethernet, 1000BASE-T has been experiencing rapid growth. With only minimal changes to the legacy cable structure, it offers 100 times faster data rates than 10BASE-T Ethernet signals. Gigabit Ethernet, in combination with Fast Ethernet and switched Ethernet, offers a cost-effective alternative to slow networks.
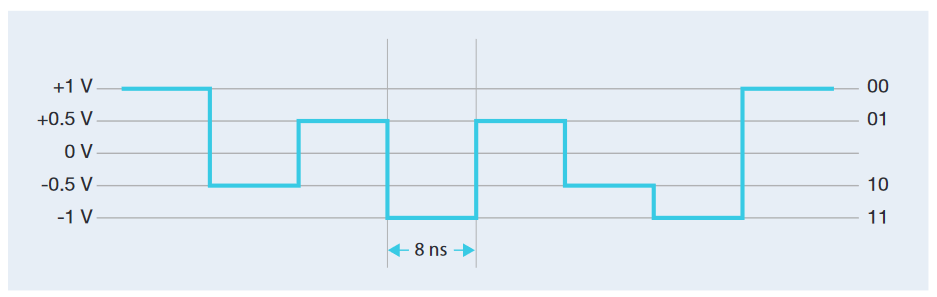
1000BASE-T uses four signal pairs for full-duplex transmission and reception over CAT-5 balanced cabling.The transmission occurs at a data rate of 250 Mbps over each pair, operating at 80% efficiency. It employs a four-level, PAM5 encoding signaling scheme as in Figure 1.
1000BASE-T Physical Layer Compliance Standards
To ensure reliable information transmission over a network, industry standards specify requirements for the network's physical layer. The IEEE 802.3 standard defines an array of compliance tests for 1000BASE-T physical layer. These tests are performed by placing the device under test in test modes specified in the standard.
While it is recommended to perform as many tests as possible, the following core tests are critical for compliance:
| Test Mode | Test | IEEE 802.3 Reference |
| Test Mode-1 | Peak Droof Template | 40.6.1.2.1 40.6.1.2.2 40.6.1.2.3 |
| Test Mode-2 Test Mode-3 |
Master Jitter Slave Jitter |
40.6.1.2.5 |
| Test Mode-4 | Distortion MDI Return Loss MDI Common Mode Voltage |
40.6.1.2.4 40.8.3.1 40.8.3.3 |
Table 1. Core 1000BASE-T tests.
1000BASE-T Test Modes
For conformance testing, test modes are enabled in the Device Under Test (DUT) to allow for testing transmitter waveform characteristics like transmitter distortion, and transmitted jitter. These test modes determine the data symbols provided to the transmitter circuitry and do not alter the electrical or jitter characteristics of the transmitter and receiver from those of normal operation. Testing a device with standardized test signals ensures the DUT will inter-operate with other Ethernet devices under normal (non-test mode) conditions.
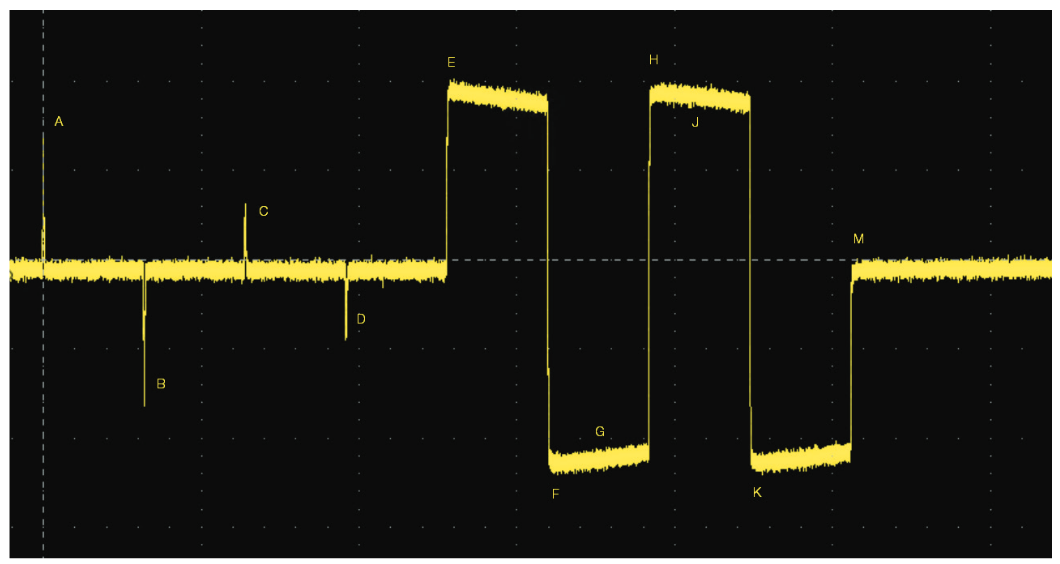
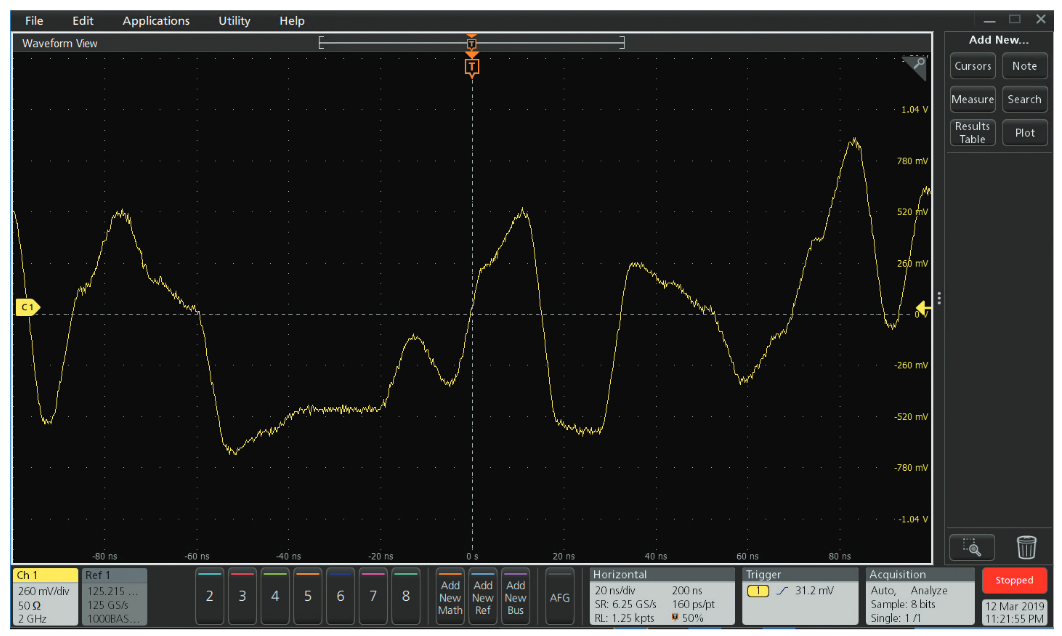
Test Mode 1 is used to test for Template, Peak and Droop conformance tests. When Test Mode 1 is enabled, the PHY transmits a sequence of data symbols continually from all four transmitters. This sequence is repeated continuously without breaks between repetitions. The typical transmitter output is shown in Figure-2.
| Sequence | Signal Level | Symbol Count | Points/Regions |
| Sequence-1 | 1x +2 | 127 x 0's | A |
| Sequence-2 | 1x -2 | 127 x 0's | B |
| Sequence-3 | 1x +1 | 127 x 0's | C |
| Sequence-4 | 1x -1 | 127 x 0's | D |
| Sequence-5 | 128x +2, 128x -2, 128x +2, 128x -2 | 127 x 0's | E, F, G, H, J, K |
| Sequence-6 | 1024 x 0's | M |
Table 2. Data signals transmitted in Test Mode 1."Points/Regions" refer to Figure 2.
When Test Mode 2 is enabled, the transmitter sends out a data symbol sequence of levels +2 and –2 repeatedly on all four channels. The transmitter controls the symbols from a 125 MHz clock in the master timing mode. The typical transmitter output in Test Mode 2 looks like a clock and is shown in Figure 3.
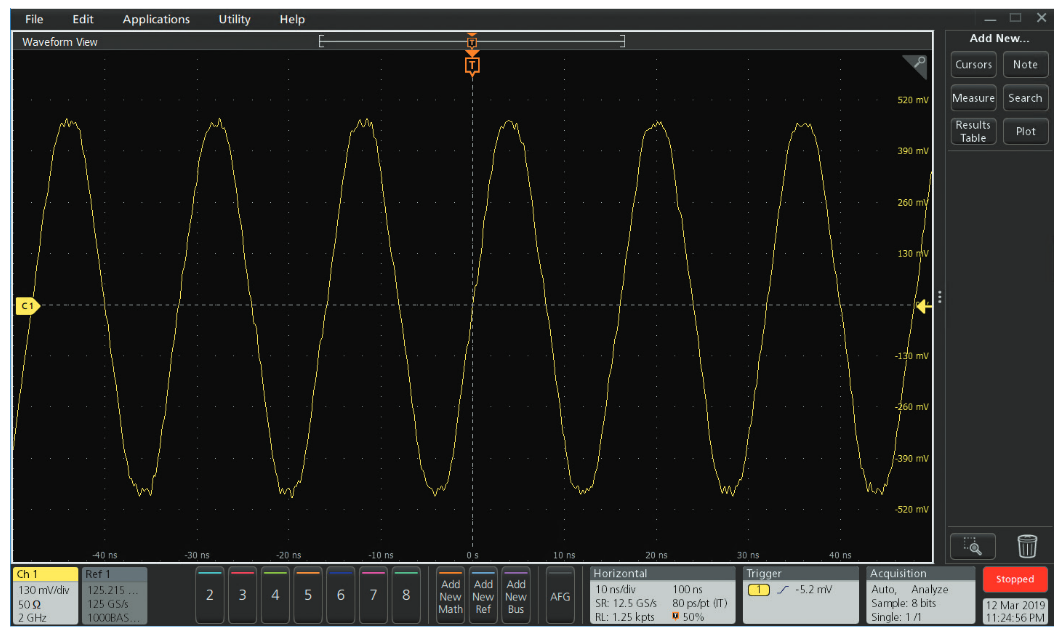
Test Mode 3 follows the same data symbol sequence as Test Mode 2 except that the transmitter controls the symbols from a 125.00 MHz clock in the slave timing mode.
When Test Mode 4 is enabled, the transmitter sends out a sequence of symbols generated by a scrambler generator polynomial, with bit generation and level mappings as defined in the IEEE spec. The maximum-length shift register used to generate the sequences defined by the polynomial is updated once per symbol interval (8 ns) resulting in a scrambled signal output, as shown in Figure 4.
1000BASE-T Tests
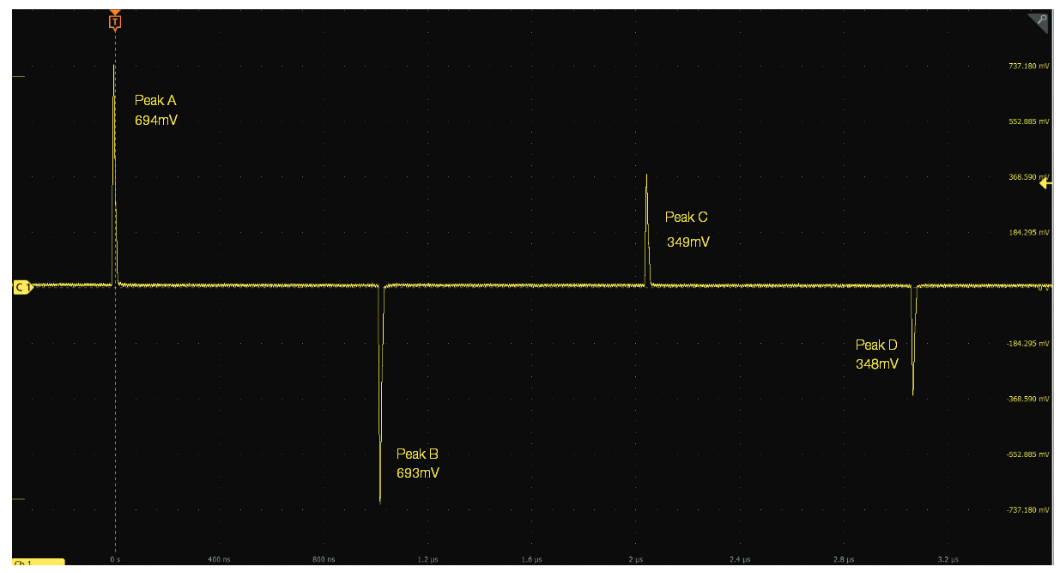
Peak Tests
A peak test is performed at the peak of the waveform at points A, B, C and D as shown in Figure 5. The criteria for passing the test is that that absolute value of the peak of the waveform at points A and B must fall within the range of 670 mV to 820 mV. These measurements are to be made for each differential pair, observing the signal at the output of the MDI port of the Device Under Test. The specification defines a relationship between points A, B, C and D in terms of the absolute and average values of the peak voltage to ensure all the peaks are within passing limits.
Droop Tests
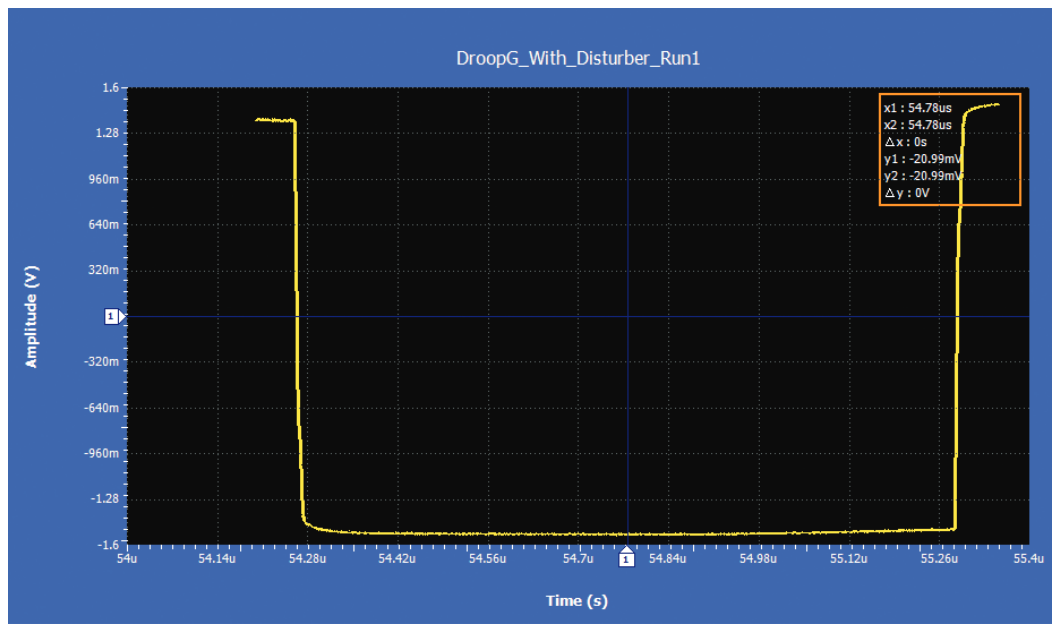
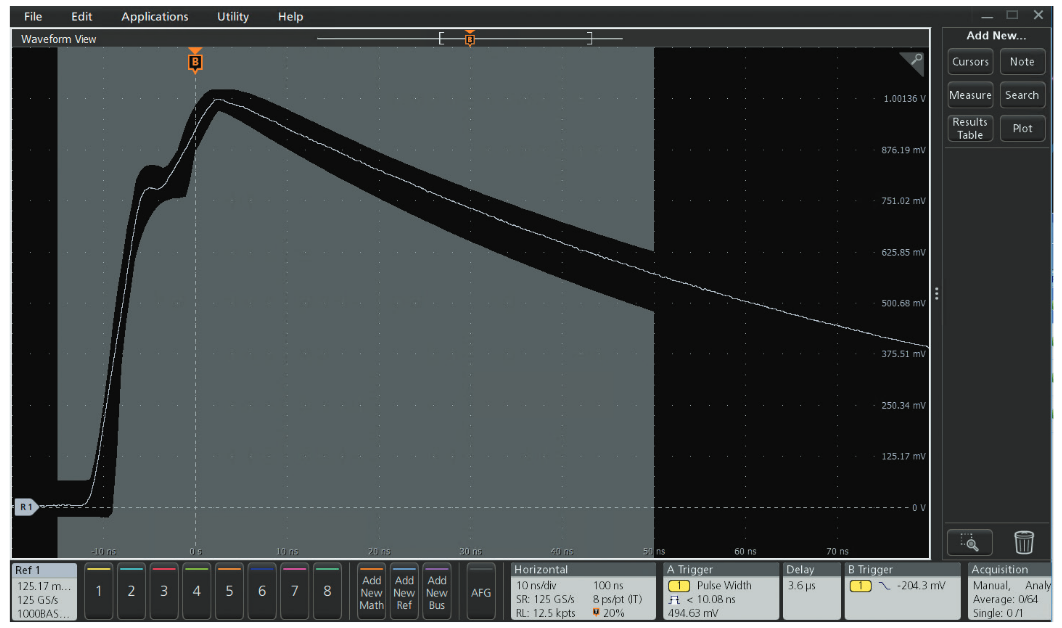
This test measures the voltage as a magnitude of the negative peak value of the waveform at point G (in Figure 2). For a pass condition, the measured value should be greater than 73.1% of the magnitude of the negative peak value of the waveform at point F. Point G is defined as the 500 ns after point F, where Point F is the point where the waveform reaches its minimum value at the location indicated in Figure 2. The same formula is used to compute Droop test results at points J and H, where point J is defined as the point exactly 500 ns after point H and Point H is defined as the point where the waveform reaches its maximum value at the location indicated in Figure 2 (positive peak). Figure 6 indicates a passing condition of Droop point G, where the measured value was -963.3 mV, which is 97.5% of the peak value of the waveform at point F, -987.5 mV.
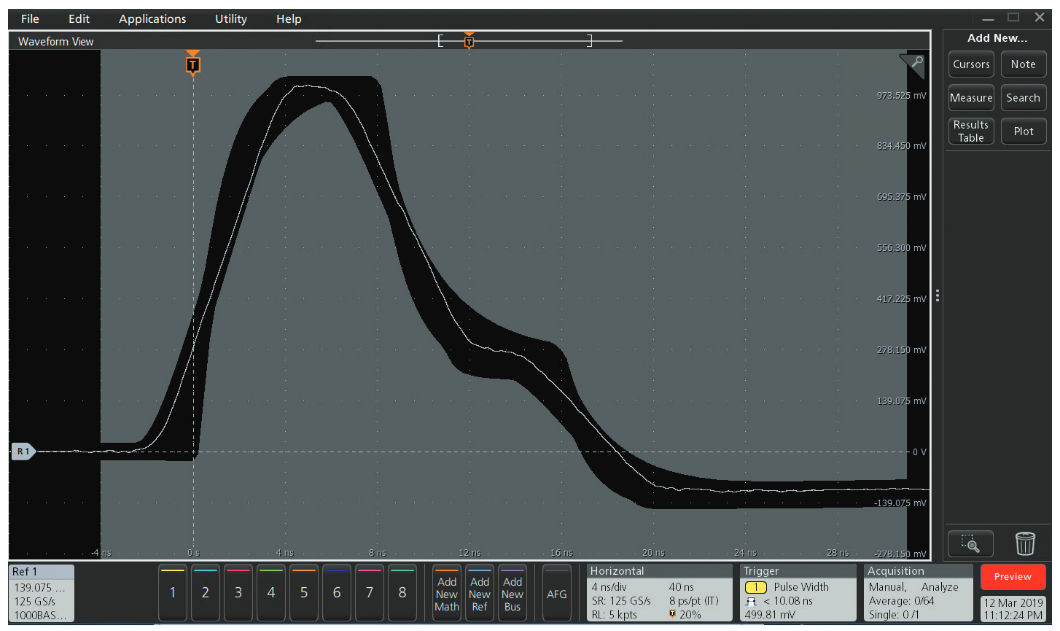
Template Tests
A template test is like a mask test which specifies the transmitter signal tolerance limits at each of the points A, B, C, D, F, and H. The 1000BASE-T spec defines a template for each of the points and allows for waveforms to be shifted in time, as appropriate to fit within the template. A normalization setting is defined in the spec for each of the points as described in Table 3. Normalization allows peaks A, B, C and D to be evaluated as ratios relative to Peak A. Points F and H are normalized with respect to their own peak voltage levels. Thus, one mask is used for points A, B, C and D and another mask is used for points F and H during compliance testing.
| Waveform Points | Normalization Definition |
| Point A | WaveformA/VpeakA |
| Point B | WaveformB/VpeakB |
| Point C | WaveformC/(VpeakA/2) |
| Point D | WaveformD/(VpeakA/2) |
| Point F | WaveformF/VpeakF |
| Point H | WaveformH/VpeakH |
Table 3. Normalization for critical points on the Test Mode 1 test signal.
Figure 7 shows the passing results of a template test at point A, and Figure 8 shows the passing results of a template test at point F.
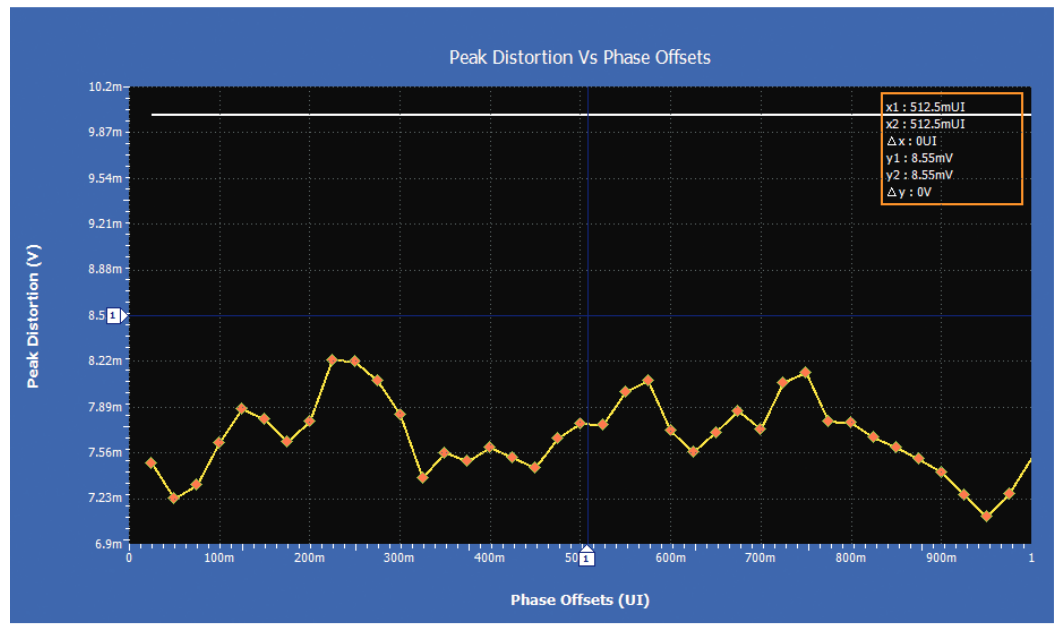
Distortion
This test is performed by putting the device under test in Test Mode 4 and observing the differential signal output at the MDI using a transmitter test fixture, for each pair, with no intervening cable. To pass the test, the peak distortion must be less than 10 mV.
Common Mode Voltage
This test measures the magnitude of the total common-mode output voltage which must be less than 50 mV peak-to-peak when transmitting data at frequencies above 1 MHz.
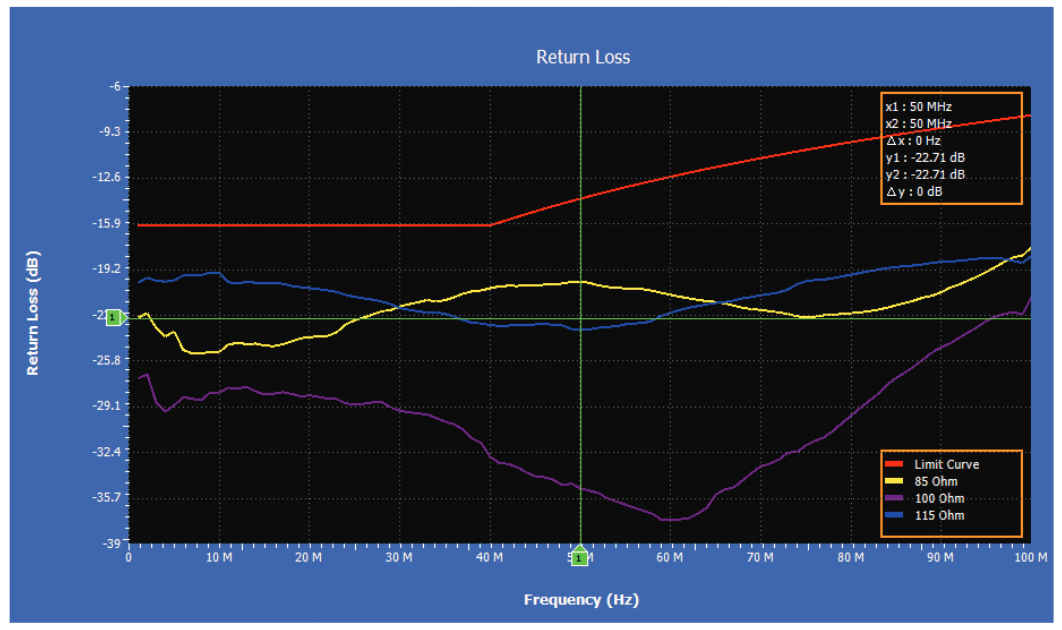
Return Loss
The return loss test indicates the performance of the transmission system. The standard defines the minimum amount of attenuation the reflected signal should have relative to the incident signal.
To ensure interoperability, the standard also specifies the impedance of the cabling system under which return loss is tested. The environment is specified as 100 Ω ± 15%. As a result, the test needs to be performed over the impedance range of 85 Ω, 100 Ω and 115 Ω.
The test is performed for transmit as well as receive pairs. The device is set to transmit scrambled signals in Idle or Halt Line state.
Figure 10 shows the three plots (85/100/115 Ω) for 1000BASE-T transmit pair.
Test Equipment
To perform the complete suite of tests described previously requires an oscilloscope, differential probes, and an Ethernet test fixture. A software tool may be needed to configure the port under test and place it in test modes.
a. Digital Oscilloscope: To choose an appropriate oscilloscope it is important to consider the rise time, sampling rate and acquisition technique of the oscilloscope. The rise time of the measurement system (right up to the probe tip) must be on the order of 400 ps. This will ensure minimal error in measurements and accurate, reliable test results.
Also, the test limits of duty cycle distortion tests and rise/ fall tests demand high sample rate. It is imperative to have a sampling rate of more than 5 GS/s to offer the resolution required for these measurements. A good fit for such applications is an oscilloscope in the 5 or 6 Series MSO platform that offers at least 1 GHz bandwidth with 400 ps rise time and 10 GS/s sampling speed.
b. Compliance Test Software: Considering the test mode signals discussed so far and the precise areas of signals where measurements need to be performed, an automated test solution is critical for performing the test procedures, allowing the engineer to spend more time on design analysis and less time setting up instruments and referring to the standard.
Tektronix offers Ethernet test automation solutions on several oscilloscope platforms. The precise TekExpress automation software varies based on the oscilloscope.
| TekExpress Ethernet Compliance Test Software | |
| 5 Series MSO | Option 5-CMENET |
| 6 Series MSO | Option 6-CMENET |
| DPO/MSO5000, 7000 and 70000 | Optioin CMENET3 |
c. Differential Probe: Gigabit Ethernet testing involves a differential transmission system. Using a pair of single-ended probes to make the measurement requires accurate deskewing and careful matching of the pairs. Failure to do so can lead to undesirable artifacts in the measurement resulting in erroneous test results.
For Gigabit Ethernet testing, either TDP1500 1.5 GHz differential voltage probes, or TDP3500 3.5 GHz differential probes are recommended. To perform return loss tests, two differential probes are required.
d. Arbitrary Waveform Generator: An Arbitrary Waveform Generator, or AWG, is used for return loss tests and as a disturber signal source. An AWG with a sample rate of 250 MS/s or above is well-suited for return loss tests. A 2-channel AWG5200 arbitrary waveform generator is a good source for return loss testing.
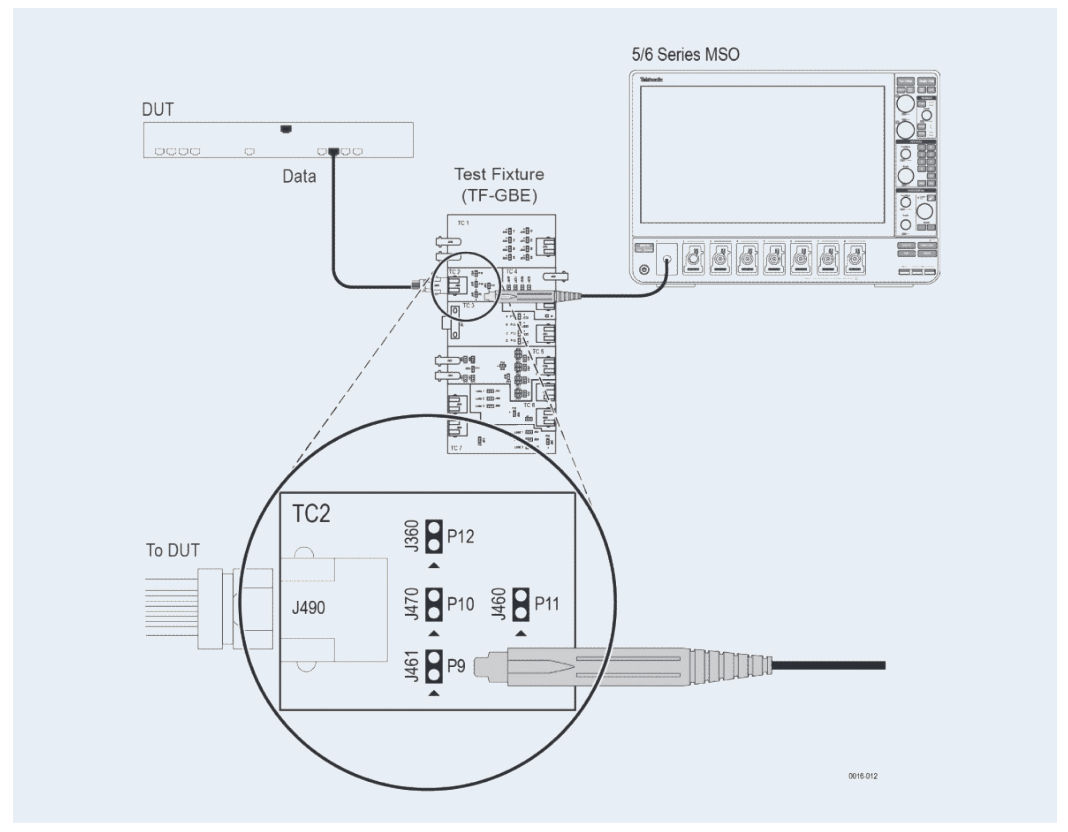
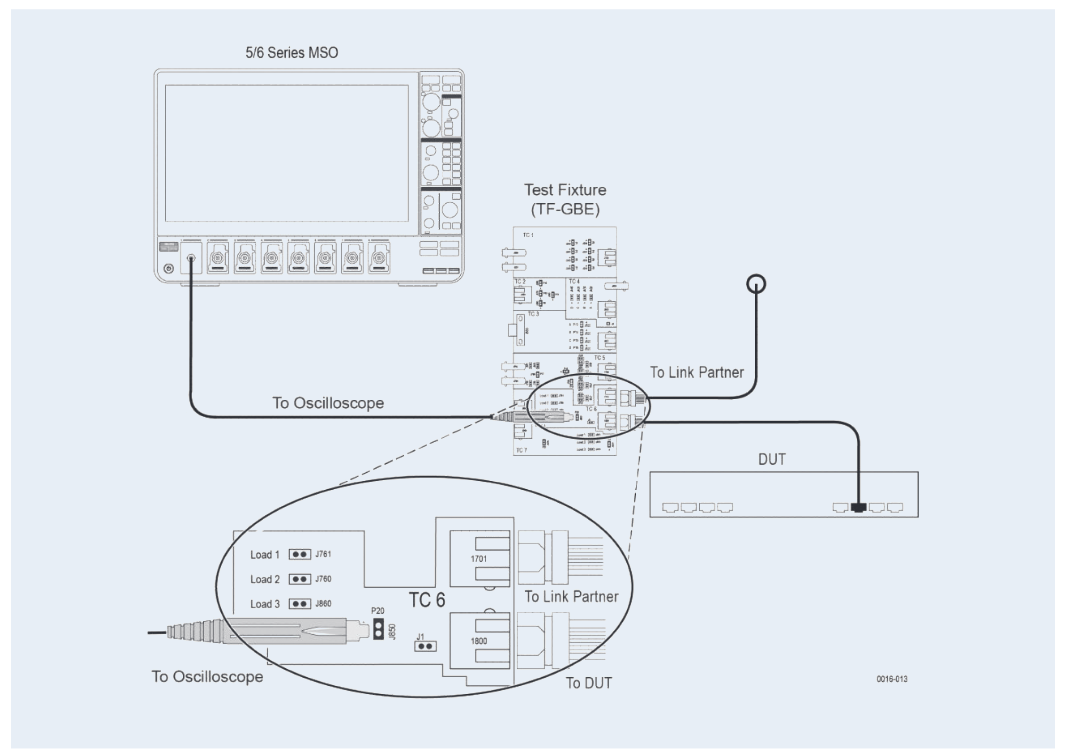
e. Test Fixture: The standard describes fixturing requirements for compliance testing. It is important to recognize that the integrity of the fixture directly affects the reliability of the tests. The Tektronix TF-GBE-BTP 1000/100/10BASE-T Basic Ethernet Test Fixture is well-suited for testing the physical layer. Carefully designed interconnects help minimize unwanted exposure to cross-talk and other side-effects. Ideally, the distance between the port under test and the probe-interconnect-point must not be more than one inch.
Generating Test Mode Signals and Performing the Test Setup
There are two predominant methods of generating the test mode signals from the port under test:
1) Configuring the port registers
Port registers are used set the port to transmit test patterns. The registers can be accessed using special software available from the silicon-provider. Contact your siliconprovider for more information on accessing port registers. Most 1000BASE-T tests including Template, Peak Volt, Droop, and Distortion tests require this method to generate the required test mode signals.
Once the port is configured to generate the test mode signal, connect as described in Figure 11.
2) Using a link partner
Connecting the port-under-test to another 1000BASE-T device (called a link partner) initiates the sequence generation. 1000BASE-T Master and Slave Jitter tests support this method of signal generation. A link partner could be a computer, a hub or a more sophisticated traffic generator.
The scheme of connections is described in Figure 12.
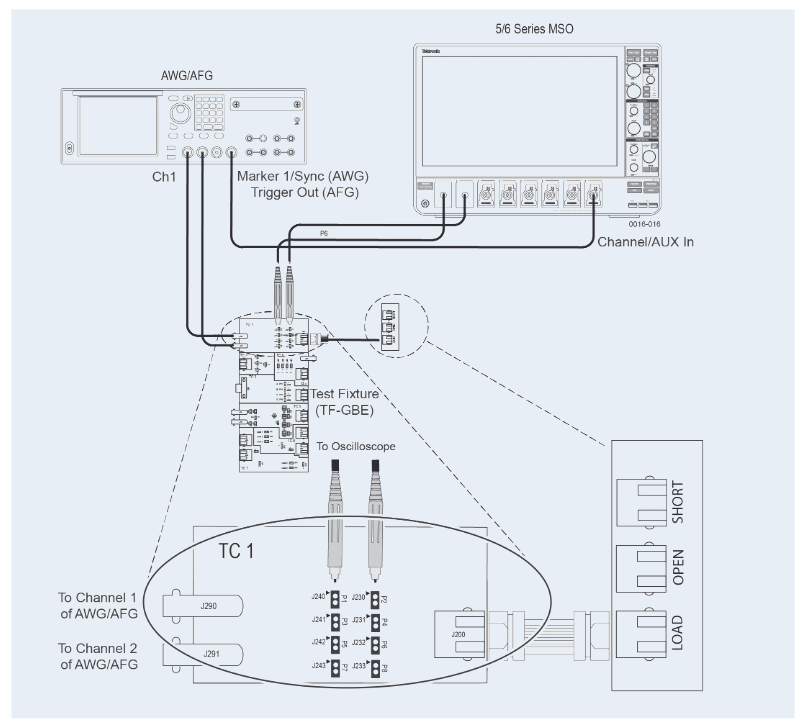
3) Test setup for the return loss test
The Tektronix method of implementation employs an oscilloscope-based approach to performing return loss measurements, eliminating the need for additional instruments.
Calibration is performed by using a section of the test fixture specifically designed for return loss calibration. During calibration, the DUT is connected to an open, load and short. The calibration data is then stored and applied during the return loss test.
For this test, the port is configured to generate scrambled sequences. The test setup is described in Figure 13. This test verifies that the return loss of the DUT is below the conformance limit.
For 1000BASE-T, the specification requires the result to be at least 16 dB over the frequency range of 1.0 MHz to 40 MHz and at least 10 - 20log 10 (f /80) dB over the frequency range 40 MHz to 100 MHz (where f is in MHz). Figure 10 shows the limit lines.
Performing the 1000BASE-T Ethernet Tests
In general, the test process involves four steps:
a. Recalling oscilloscope setups
b. Performing the test and its related measurements
c. Exporting results and screen-shots
d. Documenting test results in a report
For 1000BASE-T testing, the DUT needs to be set to specific test modes and the signal needs to be probed at specific test points on the test fixture. Any human error can lead to incorrect results if there is no mechanism to check the validity of the signal.
Performing the tests using TekExpress Ethernet Compliance Test Software
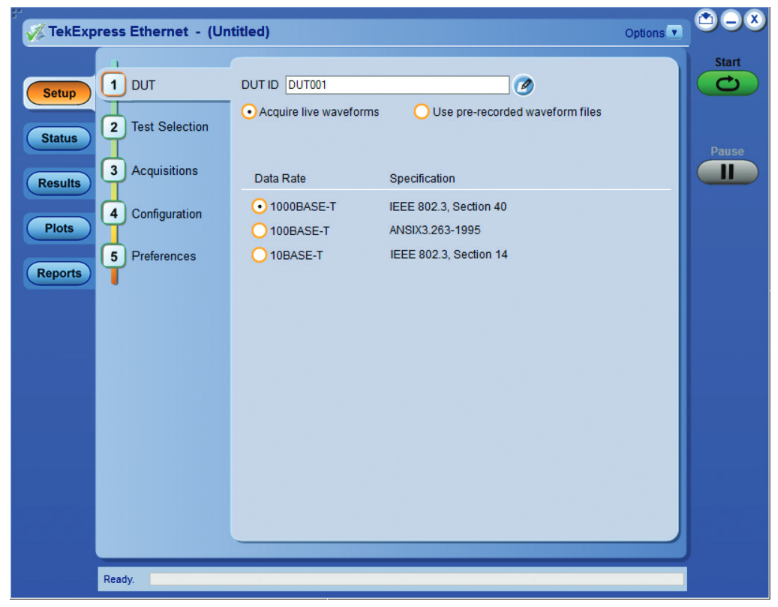
The TekExpress Ethernet automation software walks you through the test process from setup to execution to reporting. Figure 14 indicates the DUT panel of TekExpress Ethernet software with data rate selection.
TekExpress Ethernet enables testing per the standard, including scaling of the mask to 0.95 and 1.05. The user interface follows a logical test workflow yet allows flexibility in setting up tests. Figure 15 shows the test selection panel. Users can select the entire range of tests by clicking on the “Select All” button and run the tests at a press of a button.
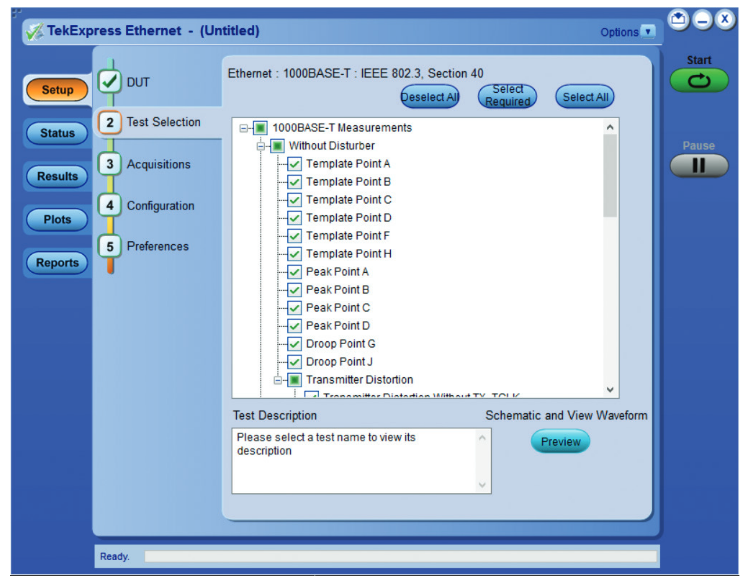
TekExpress Ethernet enables testing per the standard, including scaling of the mask to 0.95 and 1.05. The user interface follows a logical test workflow yet allows flexibility in setting up tests. Figure 15 shows the test selection panel. Users can select the entire range of tests by clicking on the “Select All” button and run the tests at a press of a button.
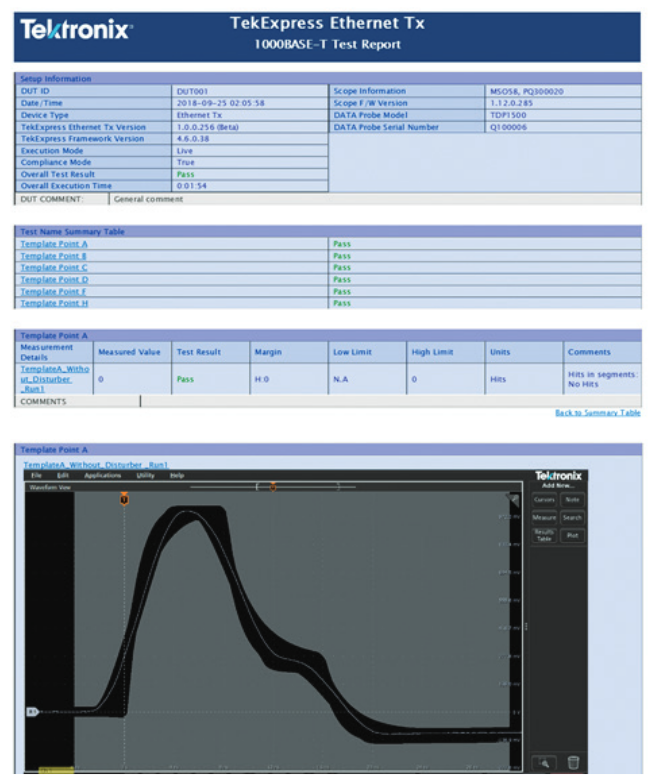
Pressing the Start button initiates the test process. After performing all the tests, the application presents the report in an .MHT format as shown in Figure 16. The report includes:
- Setup details
- Test summary table
- Detailed test results with specification limits, margins, pass/fail status
- Waveform plot images
Reports can also be generated in comma-separated-variable (CSV) or PDF format by choosing the report file type in the reports panel. This is useful when testing multiple ports or performing statistical analysis and summarizing the results. The .csv format allows easy documentation in popular tools like Microsoft Excel and helps to parse and customize the test reports in company-specific report formats.
TekExpress Ethernet compliance test software cuts validation cycles from hours to minutes.
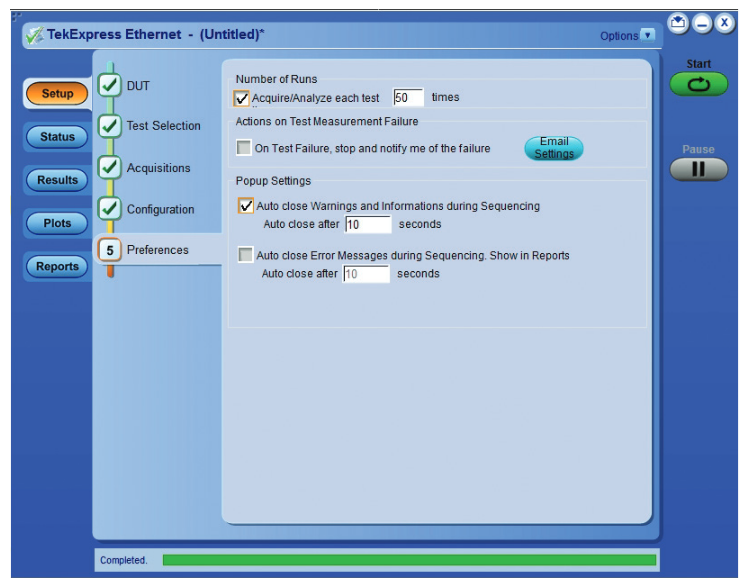
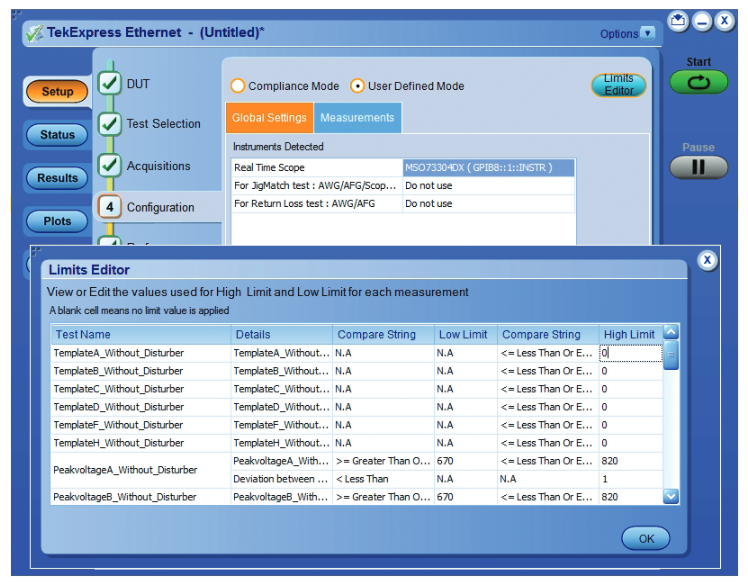
To verify repeatability and to help characterize performance, new multi-run functions facilitate repeated testing and a flexible limits editor lets you test to design margins beyond the specification limits. Figure 17 and Figure 18 highlight these capabilities.
Summary
Engineers designing or validating the Ethernet physical layer on their products need to perform a wide range of tests, quickly, reliably and efficiently.
The number of tests coupled with multi-level signals present several challenges for the test engineer. Tight margins require careful measurements and a thorough understanding of error contributors.
TekExpress Ethernet test automation software delivers significant efficiency improvements by performing a wide range of tests quickly and reliably. And innovative oscilloscope-based return loss measurements helps reduce equipment requirements while performing tests at 85, 100 and 115 Ω impedances per the standard.
Find more valuable resources at TEK.COM
Copyright © Tektronix. All rights reserved. Tektronix products are covered by U.S. and foreign patents, issued and pending. Information in this publication supersedes that in all previously published material. Specification and price change privileges reserved. TEKTRONIX and TEK are registered trademarks of Tektronix, Inc. All other trade names referenced are the service marks, trademarks or registered trademarks of their respective companies.
0919 48W-61620-0