
Introduction
The quantity and the complexity of RF devices have both grown exponentially in recent years, and the rate of technological innovation in RF is still accelerating. As a result, the cost of RF components continues to be driven downward, leading to new applications of wireless technology in a wide variety of markets outside of the traditional military and communications industries.
RF transmitters have become so pervasive that they can be found in almost any imaginable location. In the home, consumer electronics ranging from gaming consoles to household appliances send wireless data back and forth. Medical devices such as pacemakers that are implanted in the human body transmit information to monitoring equipment using RF links. In factories and warehouses, RFID has begun to supplement traditional bar codes to track and locate objects. Automobiles have GPS navigational systems, satellite radios, integrated mobile phones, remote keyless entry devices, and even tire pressure sensors sending RF signals to the vehicle’s onboard computer. This list goes on and on, and it is growing very rapidly.
As RF signals have become ubiquitous in the modern world, so too have problems with interference between the devices that generate them. Products such as mobile phones that operate in licensed spectrum must be designed not to transmit RF energy into adjacent frequency channels, which is especially challenging for complex multi-standard devices that switch between different modes of transmission and maintain simultaneous links to different network elements. Simpler devices that operate in unlicensed frequency bands must also be designed to function properly in the presence of interfering signals, and government regulations often dictate that these devices are only allowed to transmit in short bursts at low power levels.
To resist interference, avoid detection, and improve capacity, modern radar systems and commercial communications networks have become extremely complex, and both typically employ sophisticated combinations of RF techniques such as bursting, frequency hopping, code division multiple access, and adaptive modulation. Designing these types of advanced RF equipment and successfully integrating them into working systems are extremely complicated tasks.
In order to overcome all of these challenges, it is crucial for today’s engineers and scientists to be able to reliably detect and characterize RF signals that change over time, something not easily done with traditional measurement tools. To address this problem, Tektronix has designed the Real-Time Spectrum Analyzer (RSA), an instrument that can trigger signals on RF analysis, seamlessly capture them into memory, and analyze them in the frequency, time, and modulation domains.
See more Real-Time Spectrum Analyzer »
RF Analysis in Transient Signal Measurement Challenges
Given the challenge of characterizing the behavior of today’s RF analysis in devices, it is necessary to understand how frequency, amplitude, and modulation parameters behave over short and long periods of time. In these cases, using traditional tools like swept spectrum analyzers and vector signal analyzers might provide snapshots of the signal in the frequency domain and the modulation domain, but this is often not enough information to confidently describe the dynamic RF signals produced by the device. By providing insight into how parameters change over time, the RSA adds another crucial dimension to all of these measurements.
Consider the following common measurement tasks:
- – Capturing burst transmissions, glitches,switching transients
- – Characterizing PLL settling times, frequency drift, microphonics
- – Detecting intermittent interference, noise analysis
- – Capturing spread-spectrum and frequency-hopping signals
- – Analyzing frequency, amplitude, and phase content of pulsed signals
- – Monitoring spectrum usage, detecting rogue transmissions
- – Compliance testing, EMI diagnostics
- – Characterizing time-variant modulation schemes
Each measurement involves RF signals that change over time, often unpredictably. To effectively characterize these signals, engineers need a tool that can trigger on both known and unpredictable events, capture the signals seamlessly and store them in memory, and analyze the behavior of frequency, amplitude, and modulation parameters over time.
Real-Time Spectrum RF Analysis: Trigger, Capture, Analyze
The Tektronix Real-Time Spectrum Analyzer is designed specifically to address these measurement challenges associated with transient and dynamic RF signals. The fundamental concept of real-time spectrum analysis is the ability to trigger on an RF signal, seamlessly capture it into memory, and analyze it in multiple domains. This makes it possible to reliably detect and characterize RF signals that change over time.
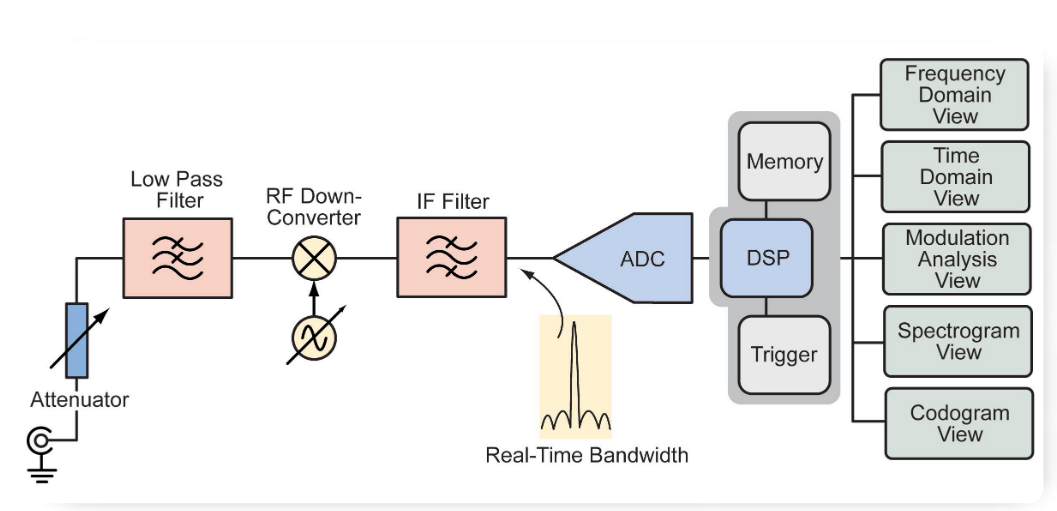
Figure 1 shows a simplified block diagram of the RSA architecture. The RF front-end can be tuned across the entire frequency range of the instrument, and, the input signal is down-converted. The signal is then filtered, digitized by the ADC, and passed to the DSP engine that manages the instrument’s triggering, memory, and analysis functions. The RSA is optimized to deliver real-time triggering, seamless signal capture, and time-correlated multi-domain analysis.
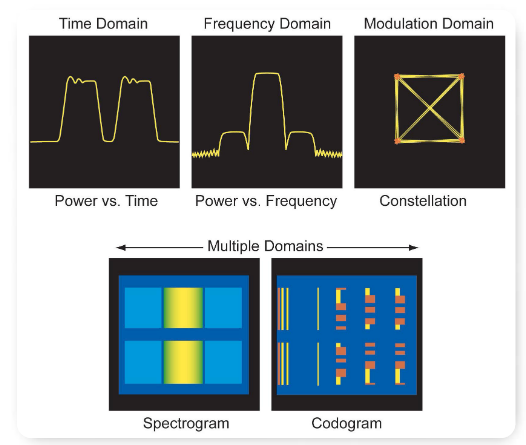
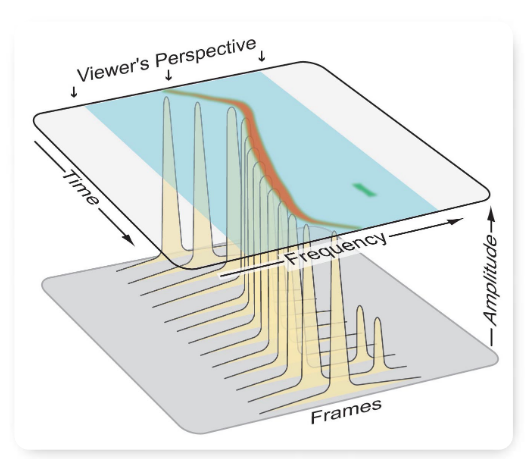
For measurement spans less than or equal to the real-time bandwidth of the RSA, this architecture provides the ability to trigger on signals in the time or frequency domain and then seamlessly capture the input signal with no gaps in time by digitizing the RF signal and storing the time-contiguous samples in memory. Then, signals can be analyzed using the wide variety of time-correlated views available in the RSA, as illustrated in Figure 2.
Once a specific RF signal has been detected, acquired, and stored, the RSA provides the ability to make frequency domain measurements, time domain measurements, and modulation domain measurements. Since all of these results are computed from the same underlying set of time domain sample data, the RSA makes it possible to correlate behavior between domains and understand how frequency, time, and modulation events are related based on a common time reference.
This allows thorough characterization of transient and dynamic RF signals that are difficult or impossible to capture and analyze using a swept spectrum analyzer or a vector signal analyzer, which is especially useful for applications requiring transient signal characterization such as system integration, device troubleshooting, and spectral monitoring.
Characterizing Signal Stability and Switching Transients
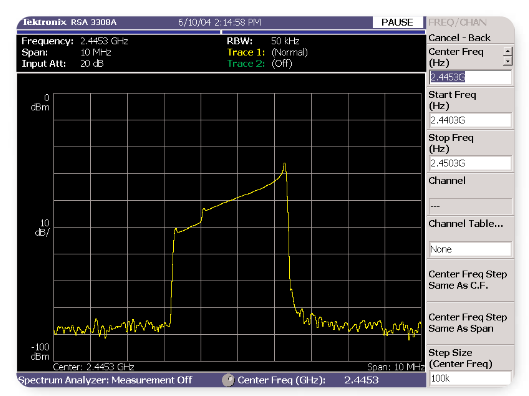
The ability to measure signal stability is a fundamental need in many electronic design and troubleshooting applications, and the complexity of modern designs and increasing circuit integration are making stability problems harder to find, capture and analyze. A traditional swept spectrum analyzer will often miss transient RF signals entirely, and even if it detects the signal the power vs. frequency display is not very insightful for dynamic signals. Based on Figure 3, for example, it is impossible to determine exactly how the signal might be changing over time.
The RSA offers several powerful tools to view signal characteristics in the time, frequency, and modulation domains. By seamless capturing RF signals into memory and then using DSP techniques to process the sampled data, the RSA can reliably show how RF signals change over time. The spectrogram, shown in Figure 4, is an important display that provides an intuitive representation of how a signal changes in the frequency domain over time. This enables engineers to confidently make measurements on bursted, transient, and frequency hopping signals, as shown in Figure 5.
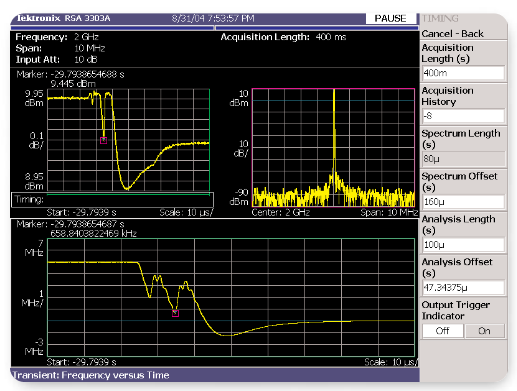
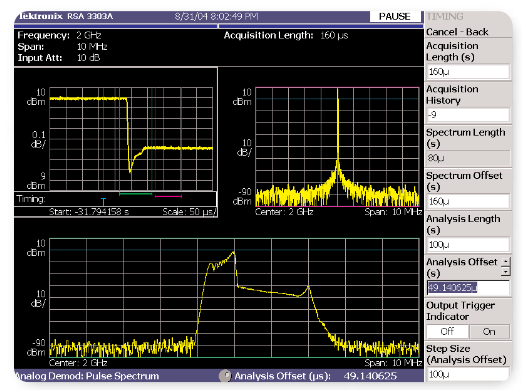
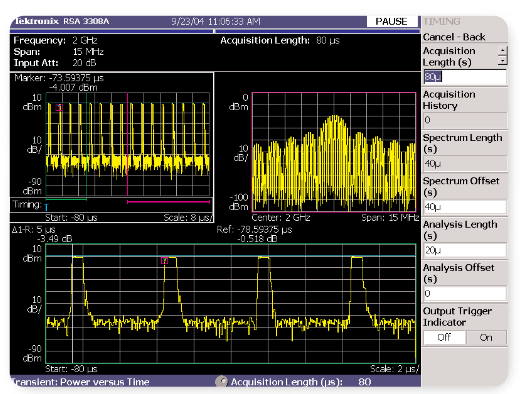
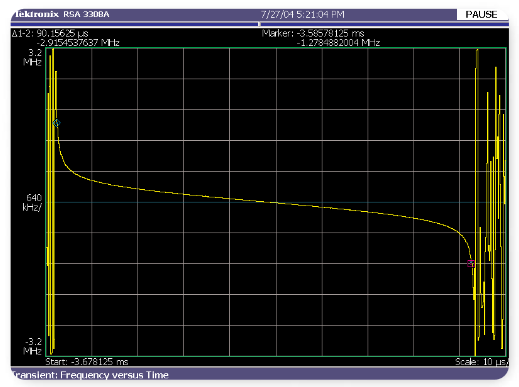
Time-correlated multi-domain analysis is another very relevant capability of the RSA. Once a signal has been captured and stored into memory, the RSA can be used to very thoroughly characterize the behavior of the signal at any given point in time. Figure 6 shows a measurement of one of the switching transients from the frequency hopping signal in Figure 5. The marker on the power vs. time display in the upper left window is tied to the marker on the frequency vs. time display in the lower window, making it easy to see how different aspects of the signal are related. The frequency domain display in the upper right window shows the spectrum of the signal after it has settled to the target frequency. Figure 7 is another example of measuring the spectral content of the signal during and after a frequency transition. The ability to apply the wide variety of measurements available in the RSA to the same captured signal and correlate their results based on a common time axis is extremely useful for understanding and troubleshooting unwanted transient events.
Troubleshooting Phase-Locked Loops
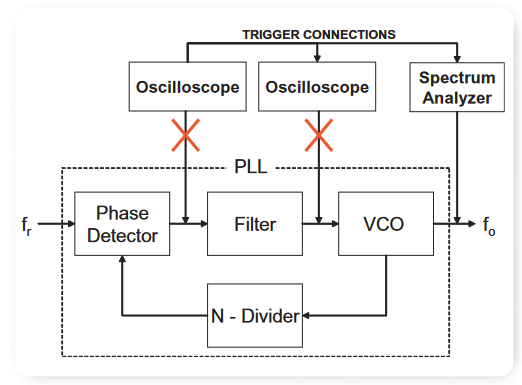
The phase-locked loop (PLL) is one of the most common circuits in use today. Although PLLs have many uses, one of the most common is to produce an accurate variable frequency reference. In its simplest form, a PLL can be thought of as a black box that takes a frequency reference (fr) input and produces a variable frequency output (fo) that is a variable multiple (N) of the frequency reference. In low frequency or simple signal applications, the PLL generally provides trouble free operation. When frequencies increase and signals become more complex, evaluating PLL performance also becomes more complex.
The traditional method for analyzing PLL performance was to sample signals at each node within the circuit (i.e. between Phase Detector, Filter, Voltage Controlled Oscillator and N-Divider). This is illustrated in Figure 8. Increasingly, however, PLLs are purchased as complete integrated circuits that do not allow access to individual nodes within the circuit. This makes troubleshooting PLL problems very difficult or even impossible. Analyzing the performance of modern PLLs with traditional methods would also require complex triggering arrangements between multiple instruments in order to capture the signal.
The ability of the RSA to view changes in frequency as a function of time allows tremendous insight into the performance of a PLL. Triggers can be set to capture and analyze a variety of PLL behaviors, including frequency switching speed, frequency settling behavior, frequency repeatability, and transient instabilities.
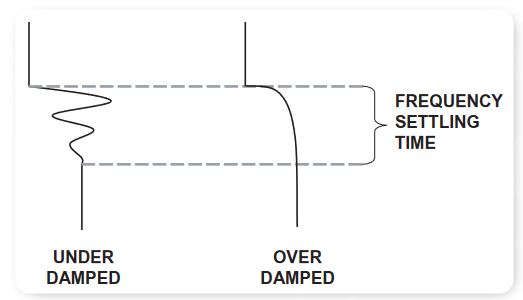
The length of time it takes the VCO to achieve the new frequency is called the settling time. PLLs generally have a mechanism for setting the amount of damping to obtain the optimal settling time. When the PLL is under damped, the PLL overshoots the final frequency before locking. When the PLL is over damped, the PLL moves too slowly in its approach to the final frequency. Figure 9 illustrates the settling profiles for these two cases.
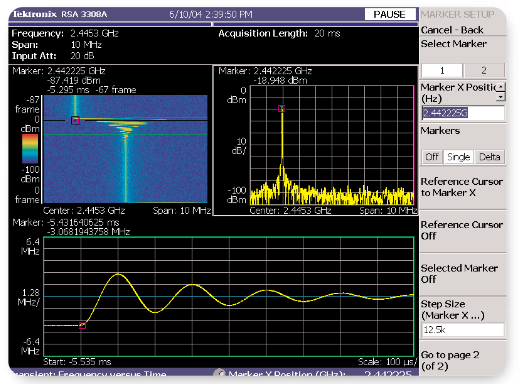
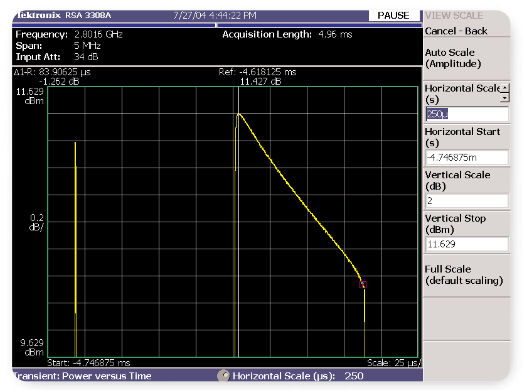
It is important to characterize this behavior so that frequency lock can be obtained as soon as possible. Figure 10 shows the frequency settling profile of a PLL whose performance could be significantly improved.
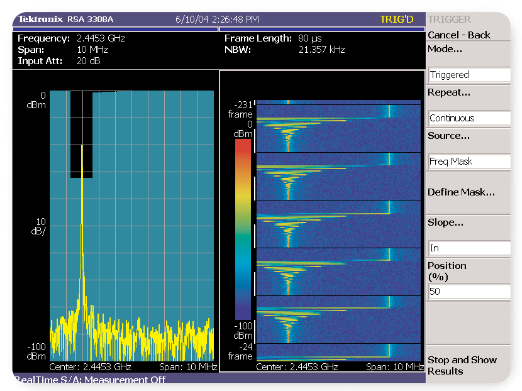
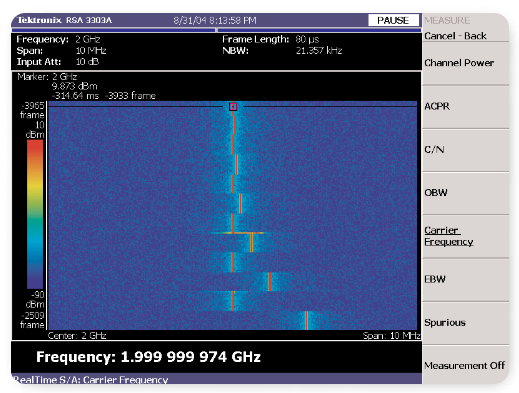
Another important characteristic of a PLL is how reliable and repeatable it locks on specific frequencies. As a result, the ability to measure the carrier frequency of multiple hops to the same frequency is important. This is another task that is simple to achieve with the RSA using the frequency mask trigger and spectrogram as shown in Figure 11. Once this data has been seamlessly captured and stored into memory, each transition can be thoroughly characterized using other measurements such as power vs. time and frequency vs. time.
Detecting Intermittent Interference
Electromagnetic interference (EMI) is a concern for nearly all electronic design applications and of particular concern for the designers of wireless technologies. With compliance agencies in most governments and militaries, designers are forced to invest substantial resources in compliance testing, often through expensive certified labs. A compliance failure is a serious setback, requiring expensive design changes, re-testing, and rework. Interference is also of great concern to wireless network operators. Because of low signal levels and wide coverage areas, low power interference can cause significant problems for their customers and, ultimately, result in lost revenue.
In all of these applications, low-level intermittent interference is difficult to detect and resolve. The traditional method of testing utilizes receivers or spectrum analyzers that are swept slowly across the band of interest. Transient and intermittent interference often goes undetected.
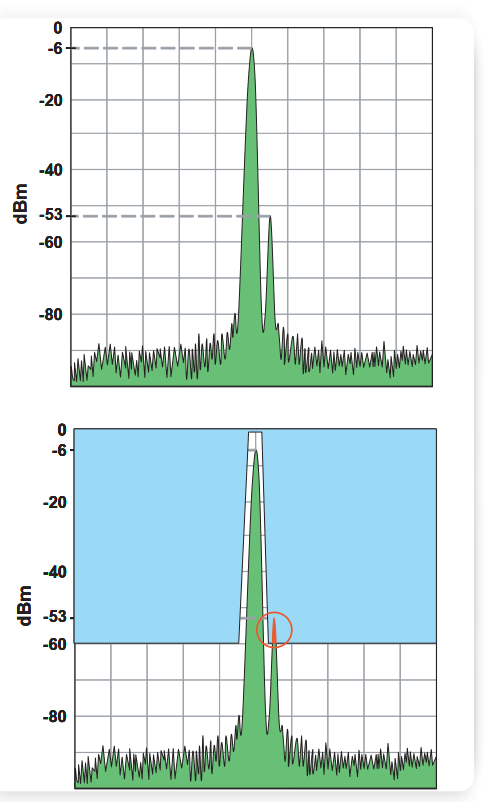
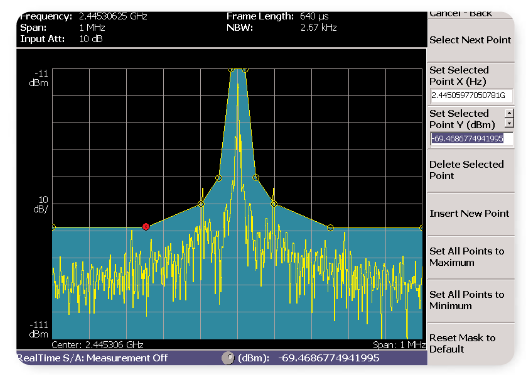
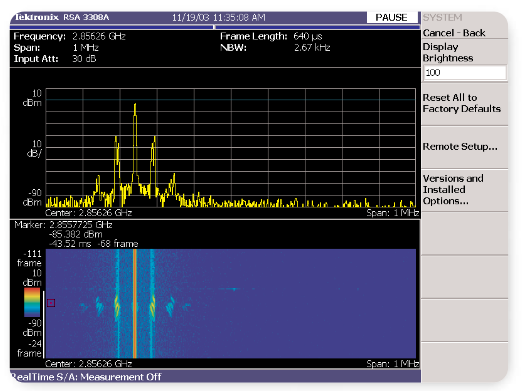
The RSA is especially well suited to find and characterize EMI and intermittent interference problems. As illustrated in Figure 12, the frequency mask trigger can be used to detect intermittent interference quickly and efficiently, and the spectrogram display shows how the interfering signal changes over time. Moreover, the ability to capture and analyze an interfering signal with a wide range of general purpose tools (time domain, analog demod, digital demod, and so on) greatly simplifies determining the source of interference.
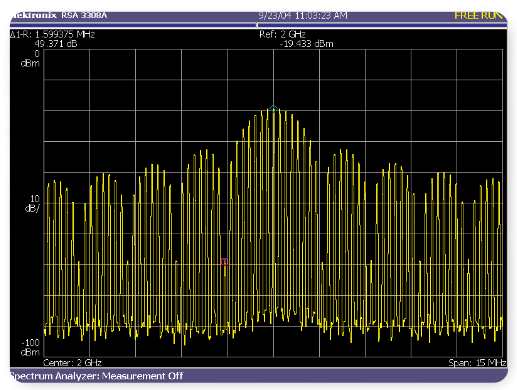
Figure 13 shows an example where the frequency mask trigger was used to capture a signal with low level distortion products caused by a sporadic unwanted amplitude modulation of the carrier. Figure 14 show the spectrogram display of transient intermodulation distortion products that were affecting the overall performance of a complex system.
Analyzing Pulsed and Bursted Signals
Most modern radar and communication systems are based on pulsed or bursted RF transmissions. Traditional measurement methods for these systems often utilize an oscilloscope to characterize the time domain behavior of bursts and a spectrum analyzer to characterize the frequency domain behavior, as shown in Figure 15. If an understanding of the modulation was also required, a modulation domain analyzer would also be a necessary tool. In order to capture bursted signals, all of these instruments need to share a common trigger.
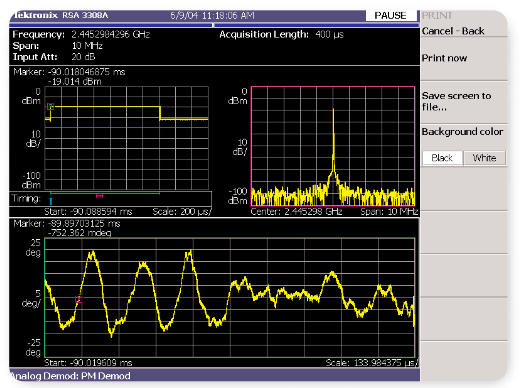
Pulsed and bursted signals can be very difficult to capture, analyze, and characterize. In many cases, these transients occur at speeds that are much too fast for traditional swept spectrum analyzers (i.e. the events occur before an entire sweep can be made). To further complicate the measurement, the fast rise/fall times of transient signals produce spectral components that are also very difficult to trigger on and capture. Many of these systems also transmit at irregular intervals, making the signals even more challenging to capture and analyze. Figures 16 through 19 are examples of how to use the RSA for detailed analysis of pulsed signals in time domain with respect to amplitude, frequency and phase.
Because the Tektronix RSA uses real-time seamless capture rather than swept analyzer technology, it is much better suited to trigger on, capture, and analyze bursts and other transients. Since the RSA captures signals in real-time and uses Fast Fourier Transforms (FFTs) to show frequency components, burst transmissions and their spectral components are not missed. The ability to set frequency mask triggers makes capturing bursts based on frequency components of interest straightforward. In addition, as mentioned in the previous examples, synchronizing the time, frequency, and modulation domains makes the analysis of signals quick and intuitive. Finally, the consolidated single-instrument interface for time, frequency, and demodulation domains results in shorter learning curves and faster analysis when compared to multiple instruments with different interfaces.
Find more valuable resources at TEK.COM
Copyright © Tektronix. All rights reserved. Tektronix products are covered by U.S. and foreign patents, issued and pending. Information in this publication supersedes that in all previously published material. Specification and price change privileges reserved. TEKTRONIX and TEK are registered trademarks of Tektronix, Inc. All other trade names referenced are the service marks, trademarks or registered trademarks of their respective companies.
02/05 37W-18188-1