Introduction
Over the past decade there has been a dramatic increase in the population of wireless transmitters found in the world, with the inevitable result being a dramatic increase in radiofrequency noise pollution. Every significant electronic device leaks radiation at some level and the number of cellular phones in circulation now outnumbers people. The growth of the Internet of Things (IoT) is only going to make things worse. Much worse in fact as billions of wireless-enabled devices populate everything from shop floors to living rooms.
At the same time, wireless technology has become critical to our daily lives. Drive down any residential neighborhood or business center with even a basic RF sniffer and you’ll see Wi-Fi transmitters in literally every location, all powered up and enabling a steady flow of vital communications. Smartphones – often with Bluetooth radios in action – keep the wheels of commerce turning and keep us connected to family and friends. Maintaining these wireless links in the face of abundant potential for interference is important work.
In today’s crowded spectrum, just about every frequency is being shared by some other device. Even if you might think you don’t have interference, chances are it’s because you haven’t bothered to look. Hunting down sources of interference can be extremely challenging and nearly impossible in some cases – for instance short duration intermodulation products – without the right tools and knowledge about such factors as antenna types and signal characteristics.
In this application note, we’ll provide an overview of interference finding techniques and offer examples to help your next interference hunting efforts to be more successful. We’ll also look at why real-time spectrum analyzers (RTSAs) have emerged as the go-to tool for tracking down elusive signals in a crowded spectrum. Once expensive and desk-bound, a new class of affordable, battery-powered, USB-based RTSAs such as the Tektronix RSA500 make an RTSA a powerful tool for interference-hunting applications.
The Interference of Things
One of the drawbacks of having so many electronic devices in our world is that they all emit electronic signals which causes the disruption of radio and wireless signals. The “noise” created by these signals creates interference with other nearby signals which disrupts transmissions. Noise can be created by a microwave oven, cell phones, poorly shielded power lines, fluorescent and neon lights or dimmer switches. With more and more electronic devices being developed and sold, there’s no doubt that noise and interference will continue to be a major issue for engineers and spectrum managers alike.
The problem is only going to get worse as the Internet of Technology (IoT) technology expands, increasing the number of signals fighting over spectrum space. It’s not a stretch to rename IoT the “interference of things.” While this is the reality of having a shared unlicensed spectrum, the challenges that the IoT are bringing are a major issue. The IoT adds very complex RF-control chips to a vast number of electronic devices such as light switches, cars and many types of appliances. Each device is a potential generator of more noise and interference. While it’s possible for design engineers to reduce the amount of noise by adding additional shielding and other noise-reducing features to products, it raises the cost to the consumer and there’s no getting around the fact that there are relatively few channels available for millions of devices.
Another challenge to tackling these issues is that there is no perfect system for detecting noise. Trying to locate problems in a city is especially difficult, compared to the suburbs or countryside, since there are so many electronic devices in use. Adding yet another layer of complexity, noise can change over time based on a wide variety of issues such as location or weather. The interference of things is already a challenge and is certain to get worse over time.
Type and Source of Intermodulation InterferenceFor anyone in spectrum management, sooner or later you will need to track down an intermodulation product that is causing interference. They can often occur intermittently and because there are multiple transmitters involved, they can be hard to identify. They will usually fall into one of the following three categories. Transmitter generated intermod — The transmitted signal from one or more transmitters is received at the output of another transmitter. This received signal must be of sufficient strength to mix with the transmitter’s own carrier in a non-linear final amplifier. This newly mixed signal is then amplified and transmitted along with the desired carrier. Receiver generated intermod — Transmitted RF energy can sometimes generate a voltage in a nearby receiver’s RF amplifier resulting into a non-linear state that allows it to act as a mixer that in turn become an unwanted intermod product. This undesired signal can be received via the antenna input or can sometimes be coupled directly into the receiver. Receivers can also be desensitized by intermod. Externally generated intermod — Loose mechanical connections or corroded metal connections form nonlinear electrical junctions and can act as unintended "diodes" or mixers. When these devices are excited by sufficient levels of one or more signals they generate intermod products. Major offenders are tower section joints, broken welding beads, improperly seated or corroded connectors in the RF chain, metal buildings, and chain-link or barbed-wire fences. |
Understanding interference
Fundamentally, interference is associated with degraded performance. It usually means that a signal is impacting your system or device causing a coverage issue, a reception issue, or an access issue. To put it simply, interference is associated with unwanted energy at the wrong place and at the wrong time. Here are the main types of interference you’re likely to encounter in one form or another:
• Co-channel interference is when more than one transmitter is on the same channel. In today’s crowded spectrum, pretty much every frequency is being shared by some other person or service.
• Adjacent channel interference comes from the energy from another transmitter. It could be nearby geographically or close to your operating frequency with much higher power.
• Impulse noise results from imperfect shielding allowing energy to leak out and interfere with RF devices. Noise can also result from a partial failure in a device or from other sources such as industrial machinery.
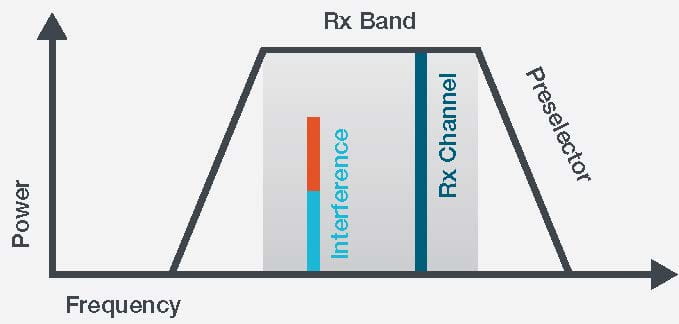
In looking at interference, it helps to understand how receivers filter out unwanted signals. As shown in Figure 1, the received or assigned channel is in blue. Interference can occur when there is energy inside the preselector of the victim receiver. This means if there is any energy falling under the preselector passband it could impact the performance of the receiver, by blocking the receiver directly or through a form of desensitization.
Interference can be particularly prevalent in metropolitan areas where tower space is limited. The solution to the limited real estate problem is to multi-couple radio systems through a system of filters, combiners and isolators. At least, that’s the theory. In practice it is a complex task to correctly design and install any multi-coupled radio system. With multiple highpower transmitters in these systems it is not uncommon to have a system level failure with the resultant intermodulation products broadcast through the common antenna.
Identifying interference
Many radio systems have built in spectrum analysis tools. These tools are useful but they are limited in their ability to characterize signals because they analyze the problem from a protocol perspective. In addition, often times they offer limited context as they view the spectrum of a signal channel. A spectrum analyzer is a better choice as it’s capable of measuring a broader portion of spectrum so that problems in an adjacent spectrum can be identified.
When on the hunt for interference the first challenge is to determine if it’s even possible to measure the interfering signal. The challenge is that radio receivers are able to detect very small signals. Therefore, the spectrum analyzer must be set up to closely mimic the sensitivity of the victim receiver to “see” what the receiver is “seeing.” For example, an average LTE receiver has a sensitivity in the area of -120 dBm. This means that any RF pollution on the receiver channel that is greater than -120 dBm can affect the operation of the receiver.
There are two controls in a spectrum analyzer to adjust sensitivity: reference level (RefLvl) and resolution bandwidth (RBW). The challenge is that when taking measurements “over the air” (OTA), the reference level needs to be kept fairly high (-30dBm), so that the spectrum analyzer doesn’t become overloaded with all of the RF energy being measured. In order to improve sensitivity, the spectrum analyzer must be configured with a narrow RBW filter.
In most spectrum analyzers the RBW control is set automatically based on the frequency span that the user has configured. In OTA measurements RBW values should be reduced in order to see small signals that could be affecting the victim receiver. This combination results in a very slow sweep rate for most battery-powered spectrum analyzers which means that it’s almost impossible to see intermittent low-level transient signals.
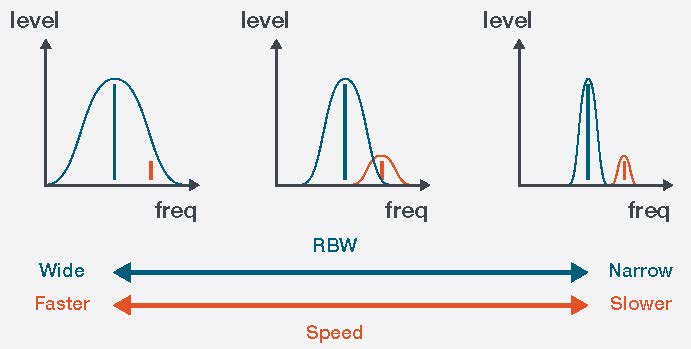
When analyzing interference problems, the RBW control is very important. The RBW filter helps us discriminate signals in the spectrum display so that we can determine individual sources of RF energy within the span we are monitoring. Figure 2 illustrates why the RBW setting is so important. If RBW is too wide, as it is on the left side, the spectrum analyzer is going to miss smaller signals that might be close to a larger signal. With a very narrow RBW, the spectrum analyzer can easily discriminate between the two signals that are close together. However, a narrow RBW will slow down the spectrum analyzer, meaning that a longer signal duration is required in order to guarantee probability of intercept.
Breaking down spectrum analyzers
In broad terms, there are two types of spectrum analyzers on the market today: swept-tune spectrum analyzers and realtime spectrum analyzers. Since getting out into the field is required to locate interference sources, swept-tune spectrum analyzers – a technology developed some 40 years ago – have long been the tool of choice. The primary reason is simple: they have been the only low-cost, portable, battery powered spectrum analyzer technology available. As noted previously, this situation has now changed with the introduction of USBbased real-time spectrum analyzers from Tektronix.
With traditional spectrum analyzers, the instrument sweeps in frequency from left to right. If you’re looking for a signal that’s not there very often, the fact that the instrument is sweeping is a problem since the offending signal could be on and off in between sweeps and never captured. The problem is personified by the probability of intercept or POI specification. The principle of probability of intercept is defined as “what is the minimum duration of the interfering signal to guarantee that the spectrum analyzer will be able to visualize the signal?”
As you might imagine, given their sweeping architecture, swept-tune spectrum analyzers have a low probability of intercept, meaning that the interfering signal may have to be on for a long period of time for a sweeping analyzer to fully characterize the signal. RTSAs are able to continuously measure the spectrum for any span up to their maximum realtime span. This means that the POI is very good even for very short duration signals. What’s more, operators are able to get the information much faster and even record and store live spectrum data for later analysis.
Deeper Signal Insight
As discussed in the previous section, the sweeping nature of traditional spectrum analyzers limits the POI when analyzing short duration signals. This problem is particularly acute when we need to make “Over The Air” (OTA) measurements. When monitoring for interference the spectrum analyzer must mimic the sensitivity of the victim receiver. By default, most spectrum analyzers will set the RBW filter as a ratio of the span setting. Figure 3 shows an OTA measurement of an LTE downlink signal. In this example it is very difficult to visually discriminate the signal due to the wide RBW filter.
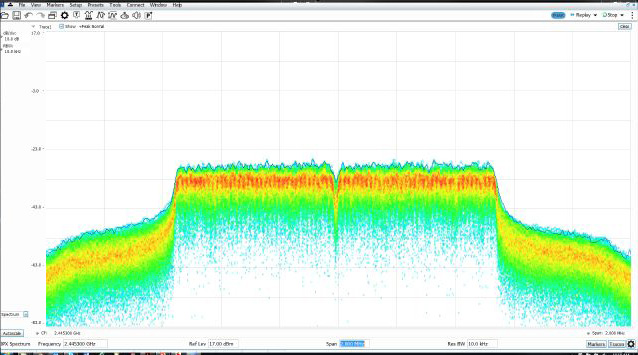
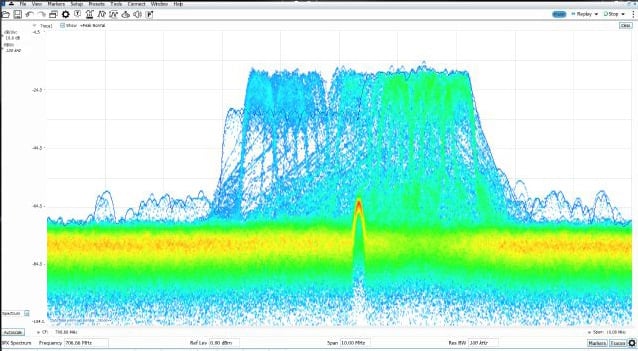
Figure 4 shows the same span, but with the RBW filter set to 1kHz. The full LTE downlink signal can now be measured and the RTSA can easily discriminate narrow band or low-level signals.
The Real Time Difference
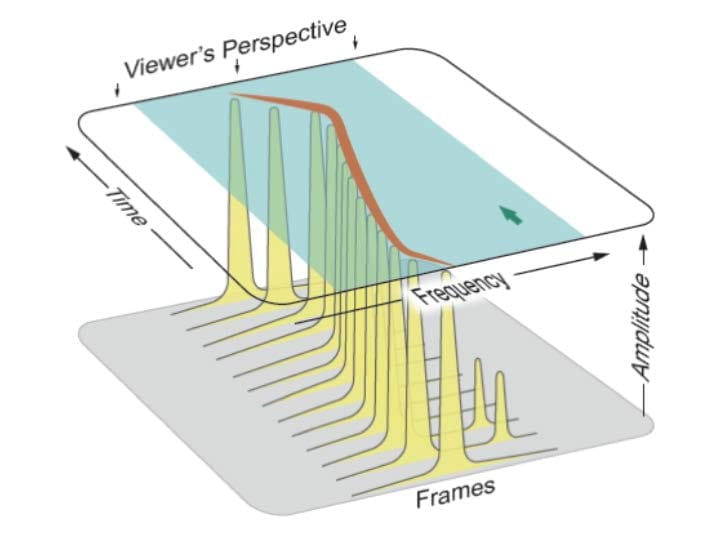
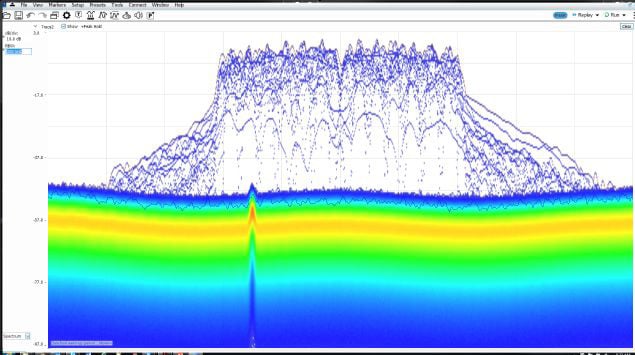
Figure 5 shows the Digital Phosphor Spectrum (DPX) display. Like a classic spectrum analyzer, it shows frequency vs. amplitude information. In addition, the pixels in the display have added color which indicates how often RF energy is being measured at that pixel. The DPX measurement also allows you to specify a decay function, providing a phosphorescent effect which mimics the effect of displays found in CRT based oscilloscopes. It adds the dimension of periodicity to the display, showing you how often a signal is actually being measured in the span of interest.
This form of real-time spectrum display lets you “see” what your receiver “sees,” and provides greater insight into what exactly is happening over the span of interest.
Monitoring the Spectrum for Long Periods of Time
To effectively identify the source of interference it is important to collect as much information as possible about how the spectrum is changing over time. The DPX measurement provides much detail, however, it doesn’t provide enough information about the potential effects of interfering signals. By their nature spectrum displays are not able to show the time interleaving of signals. Employing a “zero-span” measurement would provide good detail about pulse amplitude and duration but lack frequency information.
The spectrogram measurement is designed to address this type of problem. Like the spectrum display it will show low frequency on the left-hand side, and higher frequencies on the right-hand side. Unlike a basic spectrum display, color is used to represent amplitude, and all of this information is plotted versus time on the y-axis. The spectrogram is effectively a strip chart recorder showing the spectrum activity over time.
In a swept tuned analyzer this spectrogram will be disjointed in time as the instrument is sweeping. The SA sweeps through frequency meaning that trace points on the left side of the span occur at earlier times than trace points on the right. As such, there can be no timing relationships within a spectrogram captured by a swept analyzer. A spectrogram created by a RTSA is comprised of continuously recorded spectrum data without sweeping.
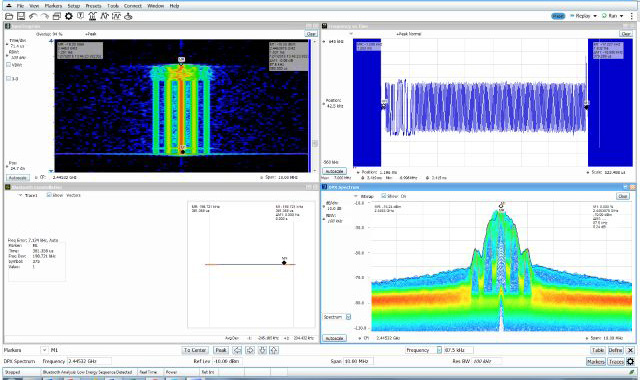
The RTSA has the added benefit of complete domain correlation, so information in the spectrogram can be directly correlated with other measurements (i.e. modulation, power, CCDF). This means that the RTSA is able to characterize timevarying events in the spectrum, including the signatures of transient RF signals.
Unattended monitoring
A useful way to find unexpected signals is by unattended mask monitoring. When RF systems are being compromised with interference it’s often time consuming to manually monitor the spectrum waiting for something to happen. Mask Search, a function built into SignalVu-PC, allows users to create a graphical mask around their frequency of interest and then trigger an action when the mask is violated.
Mask Search provides a number of trigger mechanisms:
• Signal > pre-defined level – this lets the user setup a detection threshold for a signal
• Signal < pre-defined level – this provides a RF drop-out trigger
• Signal inside a Mask – this provides a container to hold a signal
• Signal outside a Mask – this provides a shield around a signal
The challenge for most systems that employ some form of mask testing is actually creating the mask itself. SignalVuPC takes care of this by providing a means of automatically creating the mask based on the trace the user defines. Essentially you can create a “golden signal” and use this as a template for SignalVu-PC to create the mask condition. In the figure below, a mask violation has occurred in red on the mask, and a picture of the screen was saved as a result.
Direction Finding
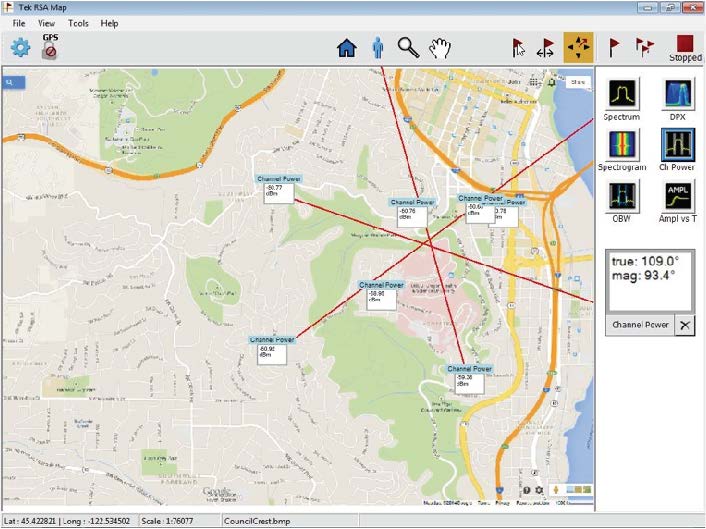
Direction finding and signal strength measurements are quick and easy with SignalVu-PC software. In the illustration below, using the available Alaris smart antenna, a compass continuously monitors antenna direction while the signal strength monitor performs measurements and provides audio indication of signal strength. When combined with the MAP option for SignalVu-PC, signal strength and azimuth are automatically placed on the map of your choice.
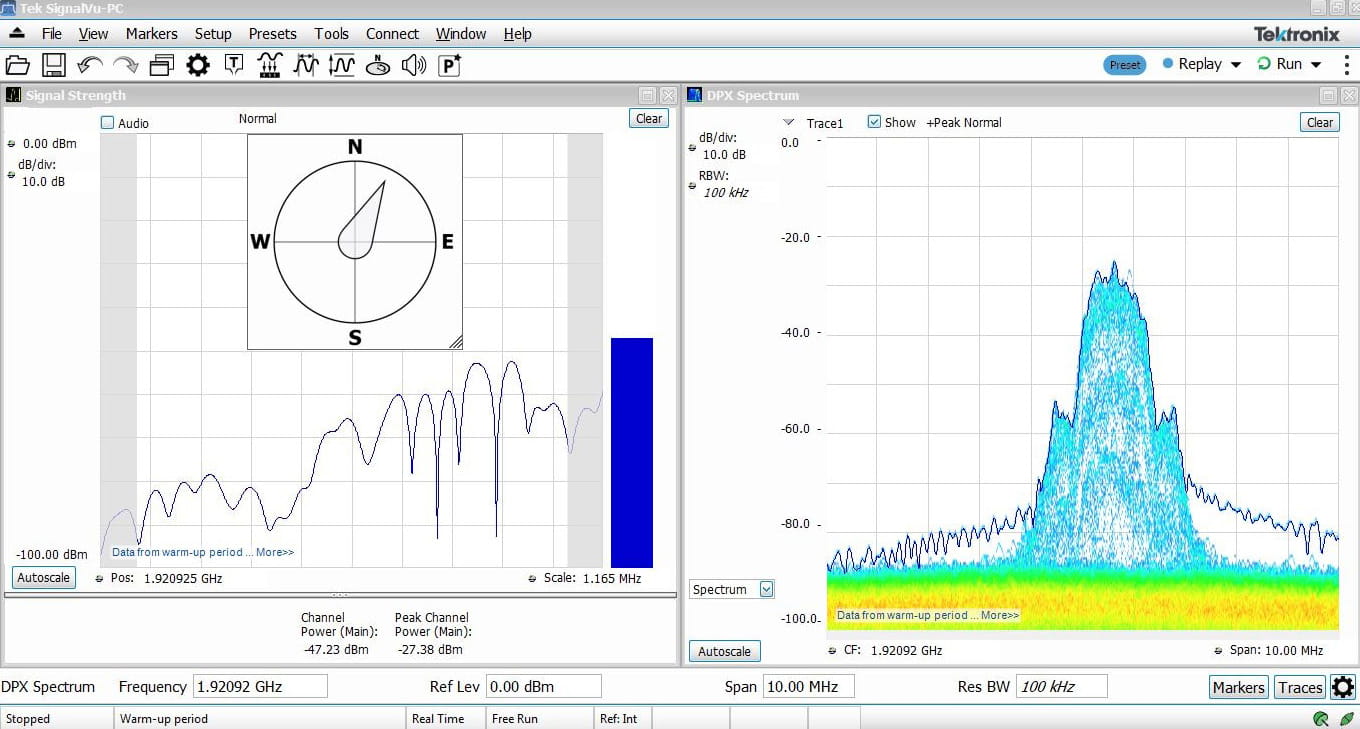
The SignalVu-PC MAP application enables interference hunting and location analysis to quickly zero in on the area of uncertainty. An azimuth function that lets you draw a line or an arrow on a mapped measurement to indicate direction, or use the available Alaris smart antenna with automated azimuth placement.
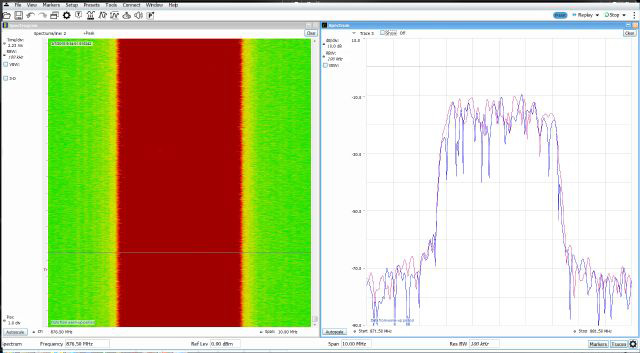
CASE STUDY: WIMAX NETWORK INTERFERENCE
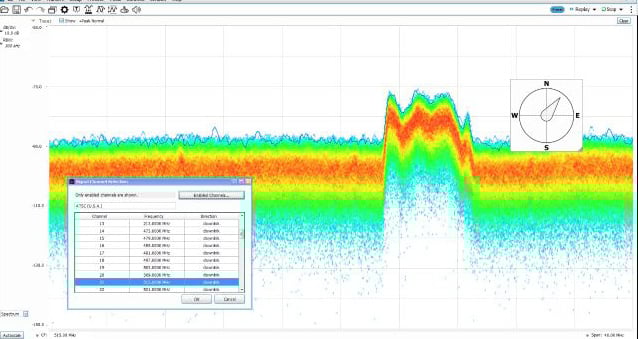
In this example of interstitial channel interference, two WiMAX operators were running into problems trying to the get the maximum performance out of their spectrum by utilizing channels on the edge of the assigned spectrum. The nearly inevitable result was that the two WiMAX base stations were interlacing with each other, reducing performance (even though the systems were still functional) particularly for victim receivers on the edge of the system coverage area. After failed attempts to identify the problem using traditional swept tune spectrum analyzers, the operators turned to a Tektronix RTSA. As shown in Figure 11 below, the spectrogram clearly showed the interlacing occurring across the base stations, allowing the operators to take the proper corrective actions.
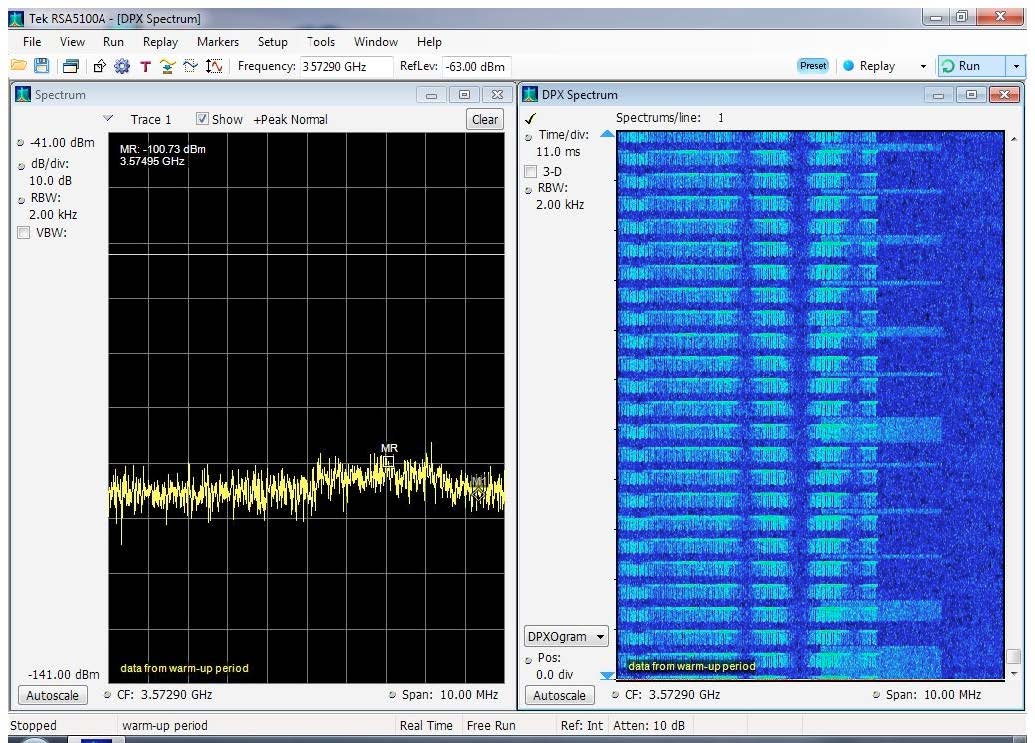
CASE STUDY: TRUNK LMR INTERFERENCE
A trunked land mobile radio (LMR) system is a complex type of computer-controlled two-way radio system that allows sharing of relatively few radio frequency channels among a large group of users. This technology is widely used by government entities to provide two-way communication for fire departments, police and other municipal services.
In this case, a LMR system in a metropolitan area was generating spurious broad-banded noise when certain conditions were met. The interference problem was particularly difficult to identify because the victim receiver frequency was > 3 MHz from the assigned frequency of the transmitter source.
Summary
Radio noise is everywhere, and the problem is only getting worse with the explosion of electronic and wireless-enabled devices. The coming IoT is certain to lead to the “interference of things.” For spectrum managers and anyone charged with tracking down sources of interference, all the noise means that traditional interference hunting tools – primarily the swept tune spectrum analyzer – are no longer adequate because of their low probability of intercept and other shortcomings.
With the introduction USB-based real-time spectrum analyzers from Tektronix, interference hunters now have the right tool for identifying short-duration signals in a noisy, crowded spectrum. With a high probability of intercept, RTSAs can see signals missed by the low-performance spectrum analyzers typically used for interference hunting. When coupled with SignalVu-PC software, Tektronix USB-based spectrum analyzers offer such powerful features as record and playback, mask search and integrated direction finding and mapping.