
Measurement Statistics: Averages and Allan Deviation
Averaging is a common calculation used to quantify performance over time or to quantify typical performance of a population. In engineering, both of these characteristics are important: How will the timing or output of your circuit change over time? Can I isolate and look at short-term instability caused by jitter?
Inherent in each of these questions is the desire to predict performance. However, more than just the average value of a set of data is needed. You need to also know how widely the data set varies around the average. Knowing the variance will tell you the extent to which you can expect “average” performance at any given time or from any particular device in the group. This is the key to determining engineering specifications – uncertainties and tolerances.
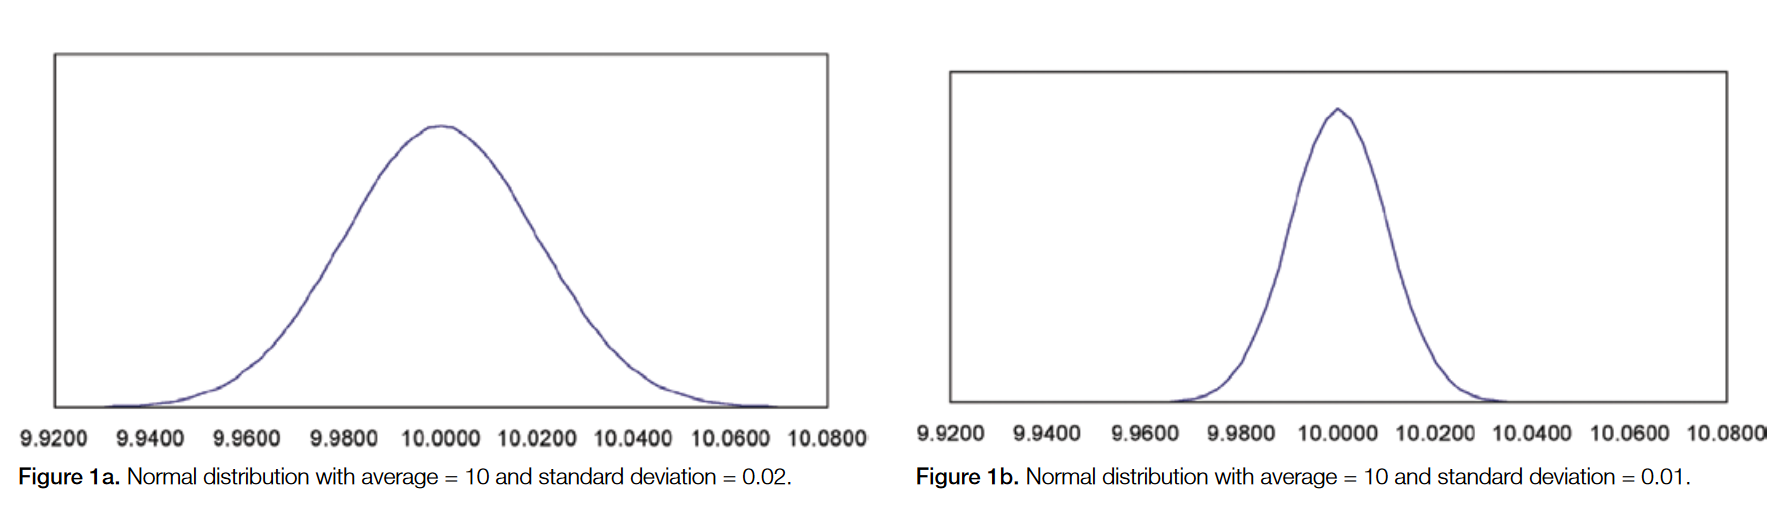
Standard deviation (σ) measures the variation or spread of a data set. In formal mathematical terms, standard deviation is the square root of the variance in a set of data. A low standard deviation indicates a tight grouping around the average, and a high standard deviation indicates a broader spread of data. Figure 1a and 1b show normal data distributions that are typical of measurement data. Figure 1a shows a set of measurements with standard deviation of 0.02, while Figure 1b shows a set of measurements with a standard deviation of 0.01. There is less uncertainty in the measurement with the lower standard deviation and thus you can be confident setting a tighter tolerance.
Allan Deviation vs. Standard Deviation
When trying to isolate short-term instability caused by jitter, this is not as possible with Standard Deviation techniques which consider the effects of all types of deviation, as all samples in the population are compared with the total mean value. Tektronix Timer/Counter Analyzers give you the ability to isolate and basically narrow in on short-term instability. Allan Deviation is a statistic used for characterizing short-term instability by means of samples (measurements) taken at short intervals. The fundamental idea is to eliminate the influence of long-term drift due to aging, temperature or wander. This is done by making consecutive comparisons of adjacent samples rather than throughout the entire population of data.
Measurement Statistics with the Tektronix FCA and MCA Series
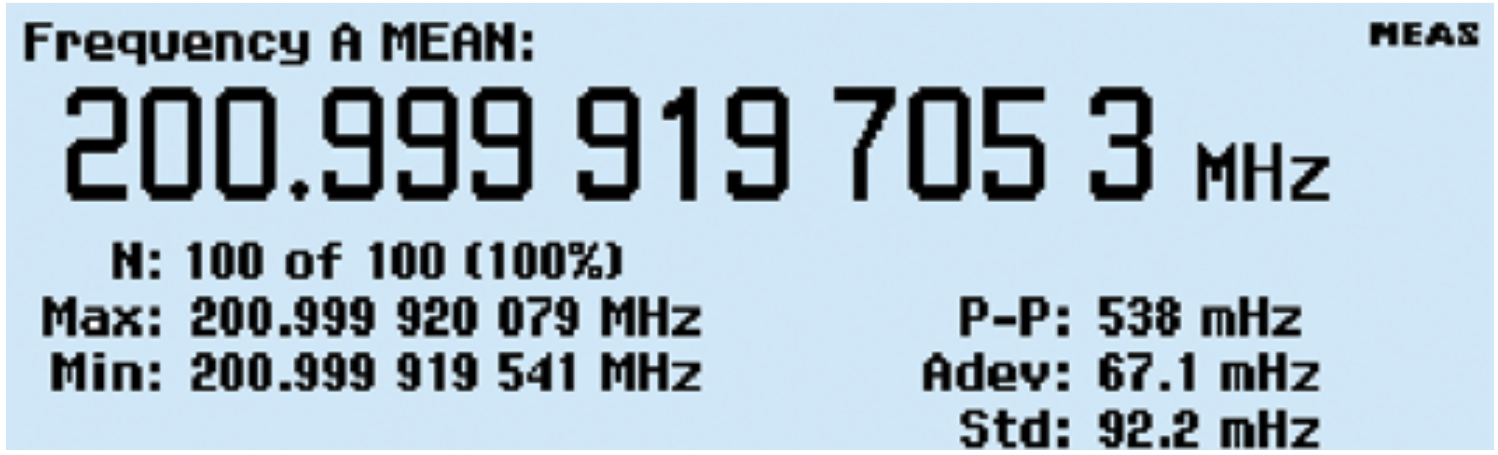
The FCA3000/3100 and MCA3000 Series Timer/Counter Analyzers provide integrated statistics processing for calculating and displaying both the standard and Allan deviation of measurements. All this data can be displayed numerically in a single readout, as shown in Figure 2.
Statistics on the FCA and MCA Series is as simple as a single button press. Press the ANALYZE key once and the Timer/ Counter Analyzer begins calculating the Average, Standard Deviation and Allan Deviation. It also displays the minimum and maximum measured values as well as the peak-to-peak deviation within a sampled population. You can reset the analyze function and start over again at any time by pressing the RESTART button.
You can also set the number of sample measurements for the Timer/Counter by pressing the SETTINGS>Stat buttons, then entering a value. (Default is 100). The statistics calculations will automatically stop once the number of readings has been reached.
Measurement Speed
When using statistics, you must be careful that your measurements do not take a long time to perform. Statistics based on 1000 samples do not give a complete measurement result until all 1000 measurements have been made, although your intermediate results are updated and displayed in the course of the data capture. Thus it can take quite some time if the setting of the counter is not optimal. Here are a few tips to speed up the process:
- Do not use AUTO trigger. It is convenient, but it takes a fraction of a second each time the timer/counter determines new trigger levels, and 1000 or 10000 times a fraction of a second can be a long time
- Do not use a longer measuring time than necessary for the required resolution
- Remember to use a short pacing time, if your application does not require data collection over a long period of time.
The HISTOGRAM Mode
Like the Statistics mode, the HISTOGRAM mode conveys the average and standard deviation of a set of measurements. But the histogram mode delivers the information in a graphical representation that quickly and clearly indicates the distribution, or spread, of measurements. For example, most measurements follow a normal distribution. That means the histogram should be symmetrical around the average and almost all of the measurements (99.7%) should be within three standard deviations. A lopsided, broad, or bimodal (two-peaked) distribution would indicate unexpected instability or error in the unit under test.
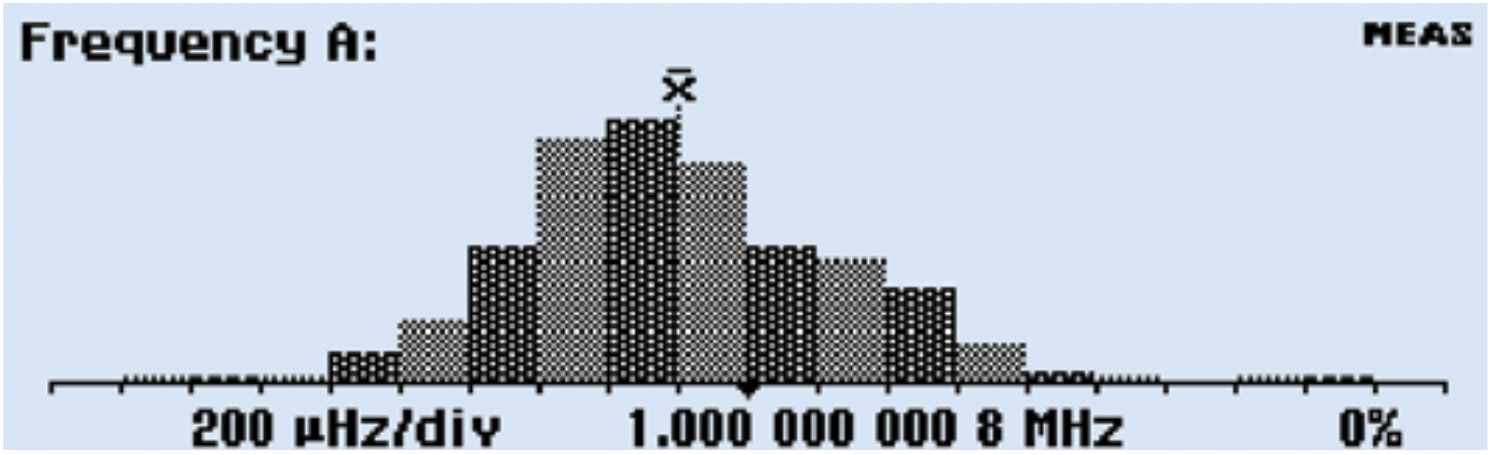
Figure 3 shows an example of the histogram display. The bins in the histogram are always autoscaled based on the measurement data. Limits, if enabled, are shown as vertical dotted lines at the center of the graph. Data outside the limits are not used for autoscaling but are replaced by an arrow indicating the direction where non-displayed values have been recorded. You can also establish the number of bins needed for the resolution you are looking for from the SETTINGS>Stat menu. The center of the display represents the average (MEAN) measurement with a dotted vertical line.
Like the Statistics mode, the Histogram mode starts as soon as the Analyze button for Histogram is pressed. The calculations can be initialized and restarted by pressing the RESTART button.
The TREND PLOT Mode
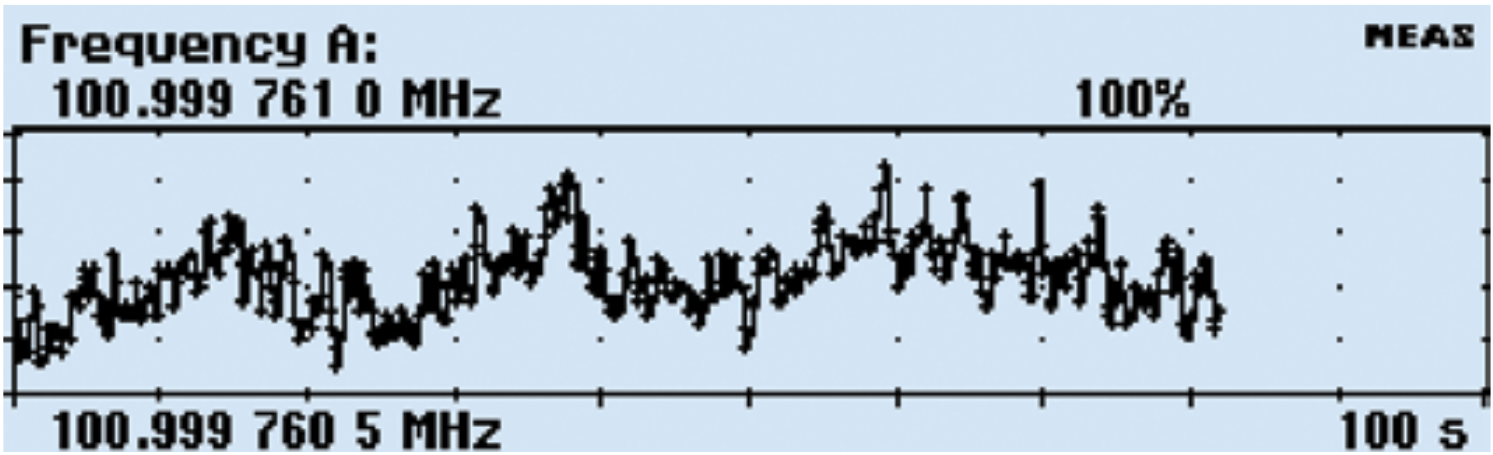
When looking for periodic fluctuations or anomalies in your signal, the Trend Plot mode is great for observing possible trends in your data. Each plot terminates (if HOLD is activated) or restarts (if RUN is activated) after the set number of samples. The trend plot is always autoscaled based on the measured data, starting with 0 at restart. Limits are shown as horizontal lines if enabled. Note that you can also watch the intermediate results update the display continually until the complete data capture is ready. This is particularly valuable if the collection of data is lengthy.
Problem Solving with Statistics
Jitter Measurements
Statistics provide an easy method of determining the short term timing instability (jitter) of pulse parameters. Jitter is usually specified with its RMS value, which is equal to the standard deviation based on single measurements. The timer/ counter can then directly measure and display the RMS jitter. Otherwise, the standard deviation of mean values can be measured. The RMS value is a good measure to quantify the jitter, but it gives no information about the distribution of the measurement values. To improve a design, it might be necessary to analyze the distribution. These measurements as well as trend analysis can be performed by means of the built in graphic analysis capability – simply by pressing the ANALYZE key to see the two graphic presentation modes.
Determining Long or Short Term Instability
When making statistical measurements, you must select measuring time in accordance with what you want to obtain - jitter or very short time (cycle to cycle) variations require that the samples be taken as Single measurements. If average is used (Freq or Period Average only), the samples used for the statistical calculations are already averaged, unless the set measuring time is less than the period time of the input signal (up to 160 MHz). Above this frequency pre-scaling by two is introduced, and as a consequence, a certain amount of averaging. This can be a great advantage when you measure medium or long time instabilities. Here averaging works as a smoothing function, eliminating the effect of jitter.
When measuring jitter you should use a limited number of samples, so that the slow variation does not become noticeable or alternatively use the dedicated statistics analysis for this kind of measurement, the Allan deviation.
To measure the slower variation you calculate Max, Min or Mean on a long series of averaged samples. Here averaging eliminates the jitter in each sample and the long measuring time and large number of samples means that the measurement can record very slow variations. The maximum pacing time is 500 s, the maximum measuring time for each sample is 1000 s, and the maximum number of samples is 2*109 , which in effect means that a single data capture could theoretically span up to 3*1012 s.
Analyze Your Device with the FCA and MCA Series Analysis Modes
Integrated Statistics, Histogram and Trend Plot modes in Tektronix FCA and MCA Series Timer/Counter Analyzers simplifies the calculation of measurement statistics when analyzing a device. Viewing your data as a histogram, trend plot or looking at the measurement statistics will allow you to track how signal parameters are changing over time, revealing signal quality issues
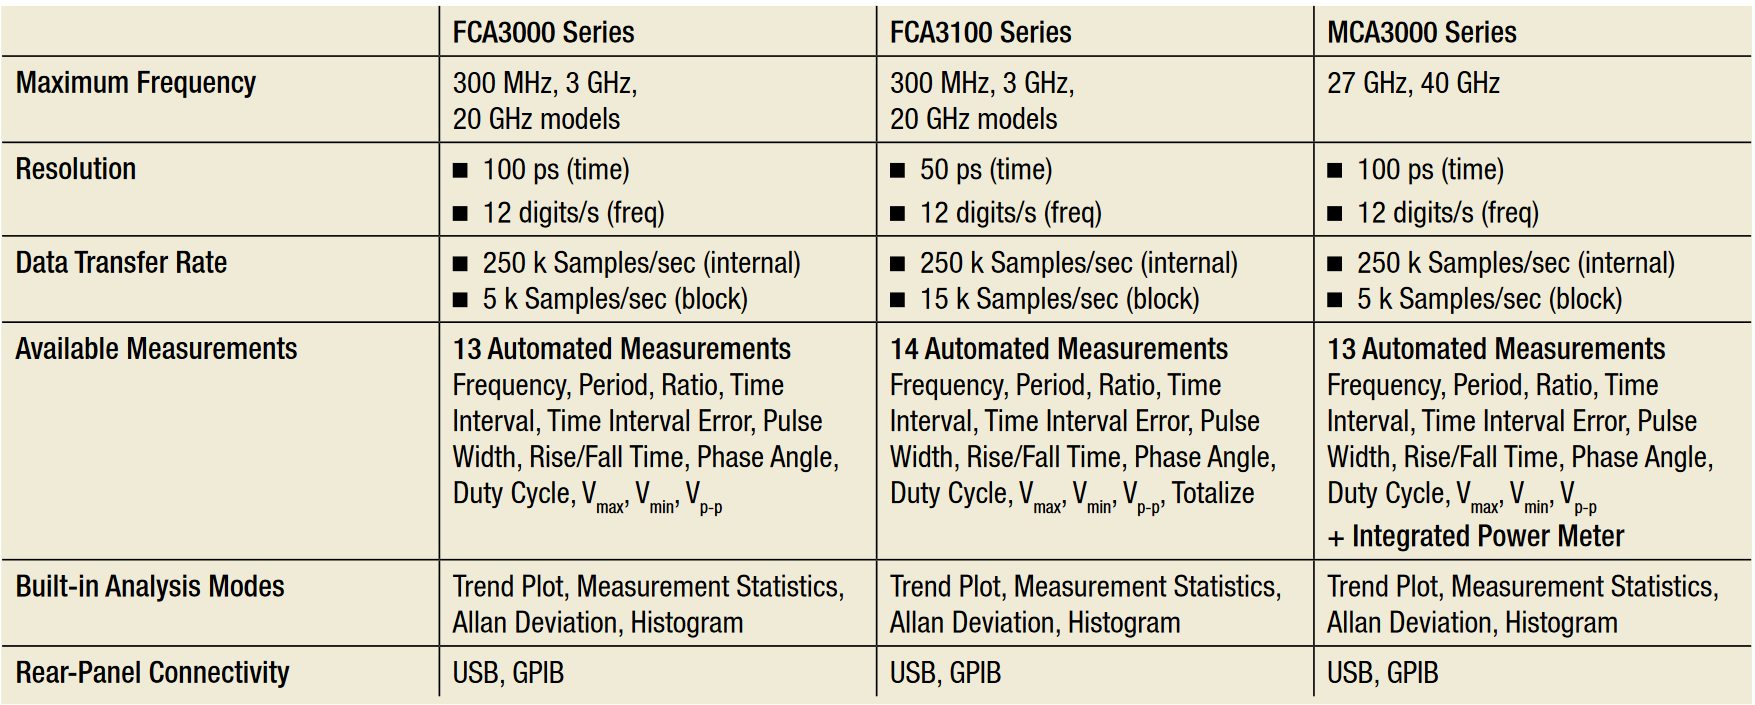
The FCA and MCA Series offer a range of models to meet your needs and your budget:
Find more valuable resources at TEK.COM
Copyright © Tektronix. All rights reserved. Tektronix products are covered by U.S. and foreign patents, issued and pending. Information in this publication supersedes that in all previously published material. Specification and price change privileges reserved. TEKTRONIX and TEK are registered trademarks of Tektronix, Inc. All other trade names referenced are the service marks, trademarks or registered trademarks of their respective companies.
09/10 3CW-25567-0