
No LCR Meter? Measure Inductance with Your Oscilloscope
Most labs have an ample supply of digital multimeters (DMMs) for measuring DC resistance, but when it comes to measuring inductance, capacitance and impedance, it is not always easy to find an LCR meter.
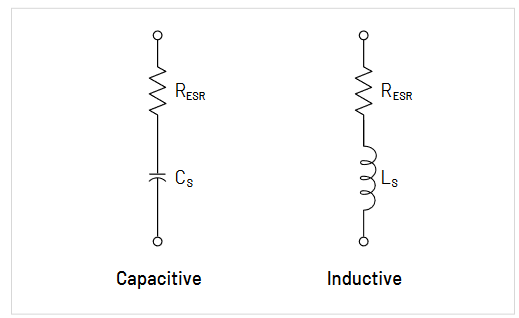
LCR meters operate by applying an AC voltage to the device under test (DUT) and measuring the resulting current, both in terms of amplitude and phase relative to the AC voltage signal. A capacitive impedance will have a current waveform that leads the voltage waveform. An inductive impedance will have a current waveform that lags behind the voltage waveform. Fortunately, if you have an oscilloscope and a function generator in your lab, you can use a similar technique to make multi-frequency impedance measurements with good results. This approach may also be adapted for use as an instructional lab exercise.
What is Impedance?
Impedance is the total opposition to current flow in an alternating current circuit. It is made up of resistance (real) and reactance (imaginary) elements and is usually represented in complex notation as Z = R + jX, where R is the resistance and X is the reactance.
Real-world components are made up of wires, connections, conductors and dielectric materials. These elements combine to make up the impedance characteristics of the component, and this impedance changes based on the test signal frequency and voltage level, the presence of a DC bias voltage or current and environmental factors such as operating temperatures or altitude. Of these potential influences, the test signal frequency is often the most significant factor.
Unlike ideal components, real components are not purely inductive or capacitive. All components have a series resistance, which is the R component in its impedance. But they also have multiple contributors to their reactance. For example, a capacitor has a series inductance that becomes more apparent at high frequencies. When we measure a real capacitor, the equivalent series inductance (ESL) will impact the capacitance reading, but we won’t be able to measure it as a separate, distinct component.
The I-V Method: Measuring Impedance with an Oscilloscope
The I-V method described in this application note is just one of many methods for measuring impedance. Others include the Bridge Method and the Resonant Method.
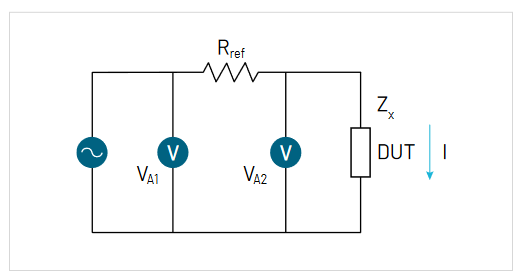
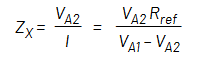
The I-V method uses the voltage and current value across the DUT to calculate the unknown impedance, Zx. The current is measured by measuring the voltage drop across a precision resistor in series with the DUT as shown in Figure 2. Equation 1 shows how the circuit can be used to find Zx.
Equation 1:
Accuracy of This Measurement Method
In this application note we will use a Tektronix 2 Series MSO Mixed Signal Oscilloscope equipped with its optional arbitrary/function generator (AFG). The 2 Series MSO will serve to provide both the stimulus and measurements. The built-in AFG’s bandwidth of 50 MHz is well-suited for this measurement. The oscilloscope’s DC gain accuracy is 3%. As you can see in Equation 1, the oscilloscope’s voltage measurement accuracy is the most critical factor in the total test accuracy.
Based on Equation 1, the theoretical accuracy of this measurement method should be about 6%.
Since the sample rate of the oscilloscope is much higher than the frequencies of the stimuli used in these tests, the error contributed by the phase measurements will be negligible.
How to Measure Inductance and Capacitance: A Step-by-Step Guide
The following two examples introduce capacitor/inductor/equivalent series resistance (ESR) measurement using an oscilloscope and a function generator.
Equipment used:
- 2 Series MSO with built-in function generator (Option 2-SOURCE)
- A 1 kΩ precision resistor
- Capacitors and inductors to be tested
- Two Tektronix TPP0200 10X voltage probes
For this application, most professional-grade oscilloscopes and function generators will give acceptable results since the test frequencies are 100 kHz and lower. For example, the Tektronix AFG1000 and AFG2000 Series are entry-level professional-grade function generators that also work well in this application.
Example 1: 10 μF ceramic capacitor
Set up the test circuit as shown in Figure 3. Note that Resr and C are both associated with the ceramic capacitor under test, and that Rfg is the 50 Ω output impedance of the function generator.
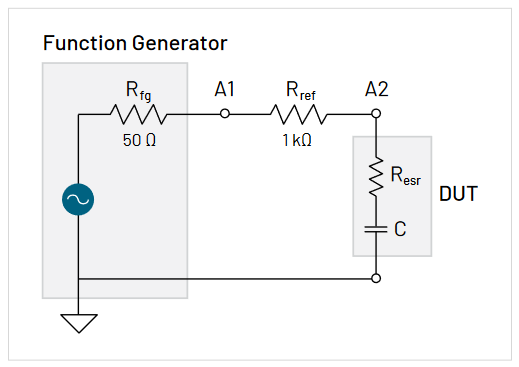
Set the function generator to output a 100 Hz sine wave with 1 Vpp amplitude at 50 Ω. (Note that the voltage measurement on the oscilloscope will be almost twice this amplitude since measurements are being made with 10 MΩ probes.) Adjust the vertical scale setting of the oscilloscope to use as much of the display as possible – by using as much of the range as possible, you will improve the accuracy of your voltage measurements.
Use the oscilloscope to probe at nodes A1 and A2. Figure 4 shows the resulting waveform.
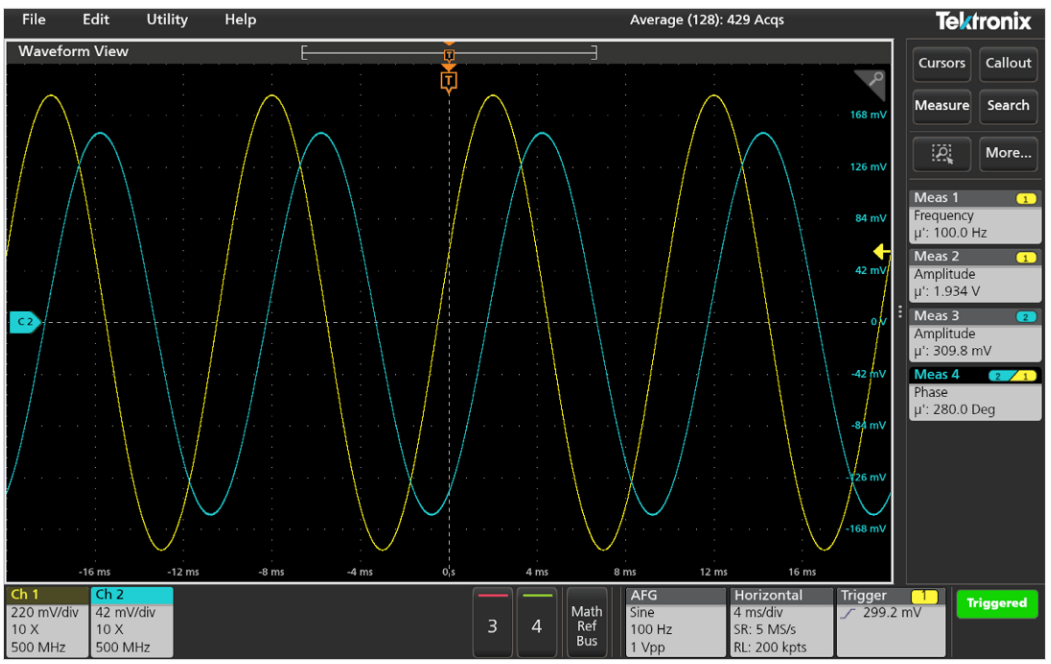
Select the oscilloscope’s average acquisition mode and set the number of averages to 128. This will reduce the effects of random noise on your measurements. Set the oscilloscope to measure the channel 1 frequency, phase between channel 2 and channel 1, channel 1 amplitude, and channel 2 amplitude as shown in Figure 4. Record these values.
From the measurement setup, we know:
Stimulus frequency, f = 100 Hz
Precision Resistor, Rref = 1 kΩ
From the measurements taken on the oscilloscope and shown in Figure 4:
Voltage amplitude measured at A1, VA1 = 1.934 V
Voltage amplitude measured at A2, VA2 = 0.310 V
Phase difference between voltage measured at A2 relative to A1,θ = 280.0° = -80.0°
The voltage at node A1 represents the total voltage drop across the test circuit, while node A2 is the drop across the capacitor under test. As expected for a series RC circuit, the voltage across the capacitor lags behind the total circuit voltage by the phase angle θ.
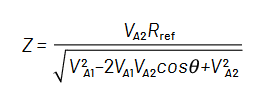
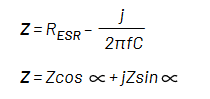
The impedance of the capacitor under test can be found using Equation 1.
The impedance can be expressed in polar form, where the magnitude is given by:
Equation 2:
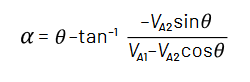
The angle of the impedance is given by subtracting the two angles:
Equation 3:
For the test in our example, we can use Equation 2 and Equation 3 to find the magnitude and angle of the impedance of the capacitor under test:
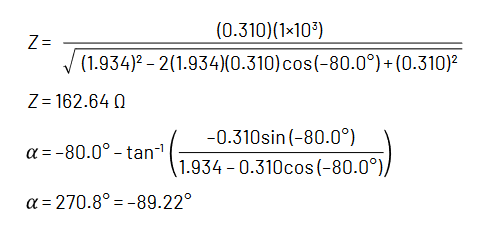
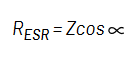
Now we can convert to the rectangular form of the impedance to find the resistance and capacitance.
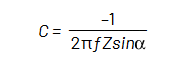
Using the equations above, we can solve for the ESR and Capacitance of the DUT:
Equation 4:
Equation 5:
Using Equation 4 and Equation 5 we can calculate the ESR and capacitance for the capacitor under test:
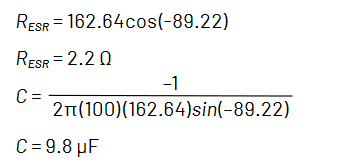
Table 1 compares the results achieved with the oscilloscope and function generator to results achieved with a low-cost VNA and a traditional LCR meter. The LCR meter used in this case only supported test frequencies of 100 Hz and 1 kHz, which are common component test frequencies. You’ll notice that the three methods correlate reasonably well.
Passive component values are specified with a particular frequency in mind, and LCR meters often have more than one test frequency for this reason. Table 1 shows the results using the oscilloscope/function generator combination at five different frequencies. You can see the effect of parasitic inductance in the test circuit as the test frequency increases – the measured capacitance drops as the test frequency increases. See the section on Measurement Range for more information on test frequencies.
| Frequency | by Scope/FG | by USB VNA | by LCR | by Scope/FG | by USB VNA | by LCR |
| capacitance (μF) | capacitance (μF) | capacitance (μF) | ESR (ohm) | ESR (ohm) | ESR (ohm) | |
| 10 Hz | 10.3 | 10.4 | N/A | 28.3 | 32.8 | N/A |
| 30 Hz | 10.1 | 10.4 | N/A | 9.1 | 7.8 | N/A |
| 100 Hz | 9.8 | 10.3 | 10.22 | 2.2 | 3.2 | 2.3 |
| 300 Hz | 9.8 | 10.1 | N/A | 0.7 | 1.1 | N/A |
| 1 kHz | 9.7 | 9.8 | 9.96 | 0.3 | 0.3 | 0.21 |
Table 1. Example 1 comparison chart. The LCR manual states 0.05% accuracy and the USB VNA manual states 2% accuracy.
For the best results, you will need to keep the value of the precision resistor (Rref) low enough to give a significant voltage waveform at node A2. The resistor should also be larger than 50 Ω or the function generator output impedance will factor into the measurement.
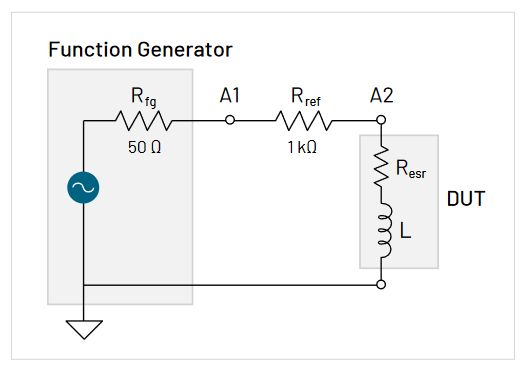
Example 2: 10 mH inductor
The test circuit and procedure are almost identical to those used to test the capacitor in Example 1.
Set the function generator to output a 10 kHz sine wave with 1 Vpp amplitude at 50 Ω. (The voltage measurement on the oscilloscope will be almost twice this amplitude since measurements are being made with high-impedance probes.) The signal is applied to the reference resistor and the inductor under test.
Use the oscilloscope to probe at nodes A1 and A2. Figure 6 shows the two resulting waveforms.
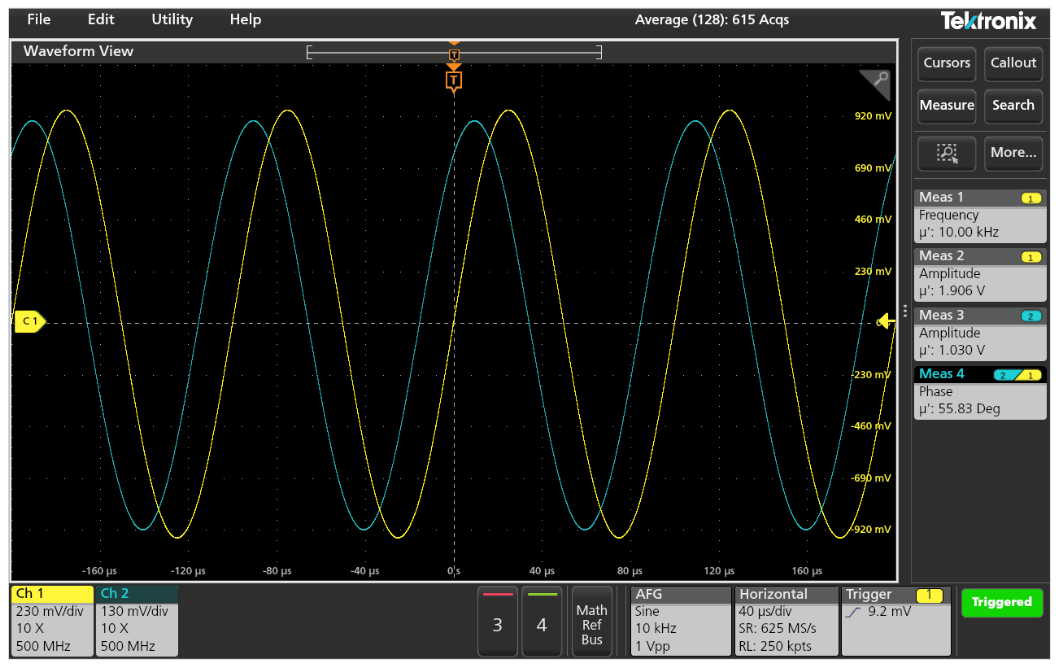
Select the oscilloscope’s average acquisition mode and set the number of averages to 128. This will reduce the effects of random noise on your measurements. Set the oscilloscope to measure the channel 1 frequency, phase between channel 2 and channel 1, channel 1 amplitude, and channel 2 amplitude as shown in Figure 6. Record the measured values.
From the measurement setup, we know:
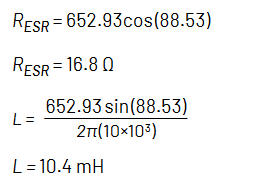
Stimulus frequency, f = 10 kHz
Precision Resistor, Rref = 1 kΩ
From the measurements taken on the oscilloscope and shown in Figure 6:
Voltage amplitude measured at A1, VA1 = 1.906 V
Voltage amplitude measured at A2, VA2 = 1.030 V
Phase difference between voltage measured at A2 relative to A1,θ = 55.83°
The voltage at node A1 represents the total voltage drop across the test circuit, and node A2 is the drop across the inductor under test. As expected for a series RL circuit, the voltage across the inductor leads the total circuit voltage by the phase angle θ.
We can use the same equations to calculate the impedance of the DUT that we used to measure the capacitor In Example 1. The impedance can be expressed in polar form, where the magnitude and angle of the impedance are given by:
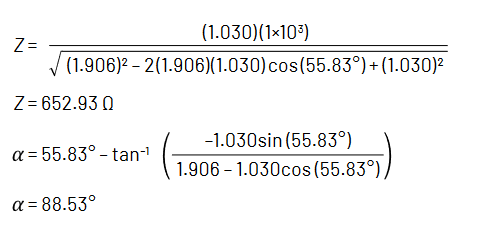
Now we can convert to the rectangular form of the impedance to find the resistance and inductance:
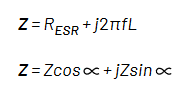
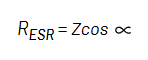
Using the equations above, we can solve for the ESR and Inductance of the DUT:
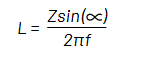
Equation 6:
Equation 7:
Using Equation 6 and Equation 7, we can calculate the ESR and inductance for the inductor under test:
As with the capacitor, the results achieved with the oscilloscope and function generator were close to those from an LCR meter and low cost VNA.
See the section on Measurement Range for more information on test frequencies.
Once again, you may need to experiment with the value of Rref to get the best results.
Optimizing for Accuracy: Frequency and Measurement Range
There are practical limits on the stimulus frequency and the DUT capacitor or inductor values for this impedance measurement method.
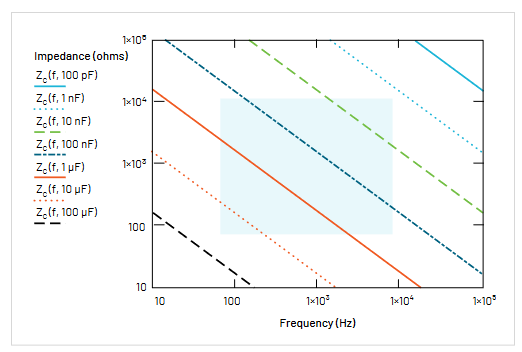
Figure 7 is a capacitance/frequency box. If a capacitance value and test frequency fall within the box, then you should be able to measure it. In the shaded region, the measurement accuracy will be about 3%, and outside the shaded area the accuracy drops to about 5%. These uncertainties assume that you’ve taken care to use the full display of the oscilloscope, averaged 128 cycles of the waveforms, and used the mean value of the amplitudes and phase to perform the calculations.
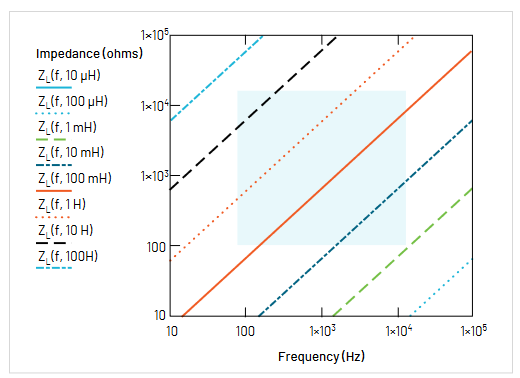
A similar inductance/frequency box is shown in Figure 8 for the inductor test.
A Powerful and Accessible Method for LCR Measurement
If you don’t have an LCR meter in your lab or you want to demonstrate the behavior of capacitors and inductors under sinusoidal stimulus, an oscilloscope and a function generator can help you to do a simple, transparent impedance measurement. You can expect capacitance and inductance values with 3%–6% uncertainty. In order to take advantage of this method, you need only a function generator with good frequency and amplitude range, an oscilloscope with good specifications and the functions we’ve discussed, a few precision resistors, and a calculator or spreadsheet.
Ready to put this method into practice? Our experts can help you select the right oscilloscope, function generator, and probes for your specific inductance and capacitance measurements.