This “how-to” series of blog posts offers an introduction to the common features of a basic digital oscilloscope and signal analysis techniques. For anyone new to oscilloscopes, these posts along with supporting videos show you how to perform important measurement tasks with oscilloscopes. These tutorials feature the new TBS2000 Series of Digital Storage Oscilloscopes.
An oscilloscope is used to investigate the health of electronic circuits by analyzing the signals at different points in the circuit. So the most fundamental goal of any oscilloscope is to show you the signals in your circuit. There are many controls on oscilloscopes, but the focus of this post is on the really important controls you’ll need to be able to clearly see signals. To make your life a little easier, the TBS2000 is equipped with an “Autoset” button to fit the signal on the scope display. Autoset doesn’t set probe attenuation, coupling and bandwidth limits, and it can’t optimize multiple signals with different frequencies, so keep reading to learn how to make manual adjustments.
Once you can see your signal, you’ll want to customize the view of your waveforms for accurate measurement and analysis. For this process it’s important for you to understand the vertical, horizontal and trigger settings.

TBS2000 scope showing two signals
The most common controls for vertical settings are:
- Channel On/Off -- Displays the waveform corresponding to the signal on an input channel, or removes the waveform from the display.
- Vertical Scale -- Sets the value of vertical divisions of the graticule in volts/div. Turning this control clockwise makes the waveform appear larger on the display, and vice versa.
- Vertical Position -- Moves the waveform up and down.
These three are the vertical controls you’ll use most often, but there are several other settings that can be useful, depending on the task at hand. On the TBS2000 and most digital scopes vertical settings appear in the input channel menu.
Setting probe type and scale factors are important because getting these wrong will mess up any measurements you take.
Attenuation refers to the factor by which the probe reduces the input signal amplitude. With a 1X probe, which could be a simple BNC cable, there is no attenuation of the signal by the probe or cable. A “10-times” (10X) probe is the most common probe. 10X attenuation means that a 1V input signal appears as 0.1V at the oscilloscope input. Thus, a 10X probe extends the maximum voltage measurement range of the oscilloscope by 10. In addition to extending the range of the scope, these 10X probes are able to look at higher frequencies and impact the circuit you’re measuring less than their 1X counterparts
Most of the time you’ll probably use voltage probes, however current measurements are common as well. Current probes produce a voltage proportional to current passing through them. If you like to do math in your head, you can always convert the voltage signal from a current probe to current values. However, by setting the probe type to current, and setting the scale factor to match the probe, most scopes will convert the vertical scale to amperes/division and all your measurements will be in amps.
Coupling determines the way the signal is passed (or not passed) through the oscilloscope input:
- DC or Direct Coupling -- Passes both AC and DC components of the signal thus making it possible to see the DC offset (if any) in the signal. This is the default and the setting you’ll use most often.
- AC Coupling -- Blocks any DC offset in the signal and only the AC portion of the signal is passed through the scope input. This mode is useful when you want to take a close look at the small fluctuations riding on a larger DC offset, for example, when you want to look at ripple on a DC power supply.
- Ground Coupling -- Disconnects the channel from the input signal and connects it to 0V reference internally. It is used to show the measurement ground level.
The vertical settings control the Y, or voltage axis. Now let’s talk about the X, or time axis. In a digital scope the horizontal scale settings are easy to use, but when you change the horizontal scale on a digital scope, a lot goes on. The scope changes not only the time scale, but also the rate at which it samples the input signal.
On digital oscilloscopes it’s important to make sure the scope is sampling more than a few times on each cycle of the input signal. If the scope samples too slowly you’ll end up with an “aliased” or under-sampled waveform that isn’t an accurate reflection of the true signal. The TBS2000 shows the sampling rate and input signal frequency so you can keep an eye on them. One way to avoid under-sampling is start with a fast time scale and work down. The most important horizontal controls are:
- Horizontal Scale -- Sets the time scale (seconds/division) and automatically adjusts sampling rate for all waveforms. This makes the waveform appear wider or narrower on the display,
- Horizontal Position -- Shifts all the waveforms on the display left or right.
- Record Length -- Sets the number of digital samples that the scope stores for each waveform.

Horizontal scale set to 400 ns/division

Horizontal scale set to 40 ns/division begins to show rise and fall time
With the horizontal scale control you can zoom in or out of the signal on the time scale. For example, a square wave might look like it’s making an instantaneous transition from low to high levels. However, when you change the scale and zoom in, you will see that the edge actually ramps up over some rise time and you’ll probably see some overshoot at the top.
Getting stable waveforms with trigger settings
Now let’s look at how to use an oscilloscope’s trigger system to get a stable waveform. It’s impossible to check the shape of a signal or take measurements with the waveform spooling across the display as shown below, which is where the trigger system comes in. This system lets you specify a point on your signal and captures at that point, synchronizing the scope with your signal.

Example of jumbled waveforms
With the right trigger settings, you can make the repetitive waveforms appear stationary for precise measurements, or even capture single-shot waveforms like in the example below showing once-in-a-while events.

Capturing a single-shot waveform
A detailed trigger menu can be instantly accessed by pressing (appropriately enough) the “trigger menu” button on the front panel. TBS2000 Series oscilloscopes offer a few different types of triggers, but for now let’s focus on one you will be using frequently: edge triggering.

The trigger menu is easily accessed from a front-panel button
With edge triggering, the waveform is captured when the signal on the trigger source passes through a specific level on a rising or falling edge (hence the name) of the trigger source. Specifying the trigger involves three parameters: trigger level, source, and coupling.
When you adjust the trigger level, it shows up on the display to help select the correct setting. A small (T) icon shows the trigger point, which lines up with the intersection of the input signal and the trigger level. Note that the part of the waveform before the trigger point is called pre-trigger data and the part after the trigger is known as post-trigger data.

Trigger point, pre- and post-trigger data
Each of the scope’s input channels can be used as the trigger source. The AC power line can also be used to sync up the scope. This is useful when you’re working on power supplies or looking for power line noise in a circuit.
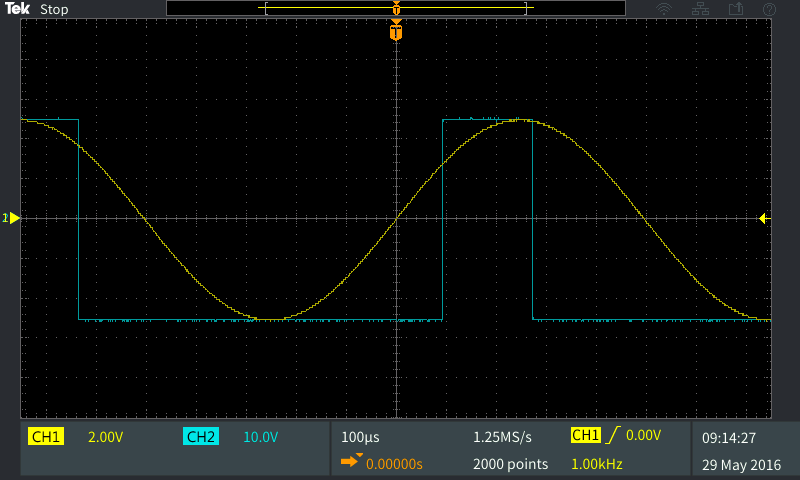
Finding the right trigger source can be the key to analyzing complex signals. For example, it can be difficult to get a stable display on an amplitude modulated (AM) signal as shown in the first image below. But, if you can connect to the modulating signal or envelope and use it as a trigger source, it’s easy to get a clear picture, as show in the example of a perfectly triggered waveform below.

Getting a stable display on an AM signal can be difficult

Connecting to the modulating signal provides a clear picture
A trigger source can also have coupling, which changes how the scope sees the trigger signal. For example, in the real-world, you’ll come across signals that are very noisy. If you use a signal with noise as a trigger source and use the default direct coupling, you’ll end up with jumpy triggering, as shown in the screen capture below.

You’ll frequently encounter noisy sine waves like this and jumpy triggering
By using “HF Reject” coupling, the scope will filter out high-frequency noise from the trigger source, giving you a stable correctly triggered waveform, as seen below:

Using “HF Reject” to filter high frequency noise from a trigger source
Depending on the signal you may need to reject low frequencies instead of the high frequencies in the above example or you could use a function to reject noise more broadly. Noise Reject coupling makes the trigger system slightly less sensitive to avoid triggering on noise.
Another basic trigger control you should understand is the default or AUTO trigger mode. In AUTO, the scope waits for a trigger and if it doesn’t see one, it captures and displays a waveform even if trigger conditions aren’t being met. AUTO mode might show waveforms that aren’t synchronized; however, it’s useful for setting up a trigger. For signals that meet trigger conditions often, AUTO mode will give you a stable trigger.

Selection of AUTO mode
Another trigger mode option is “normal mode.” When the trigger system is in normal mode, the scope acquires a waveform only when a trigger condition is being met. This mode is useful if you’re looking for specific conditions that don’t occur very often.
In some cases, the trigger conditions may be very close to each other on time scale. To avoid multiple unwanted triggering, you can use the HOLD OFF feature. Trigger hold off is an adjustable period of time after a valid trigger during which the oscilloscope won’t trigger. Setting the hold off time to a period larger than a burst and in-between the burst interval helps in correctly displaying the signal and enabling accurate measurement, as shown below:

Changing holdoff time helps to enable accurate measurements
In the next post in this series, we’ll take this discussion to the next level with some advanced triggering techniques that are useful for capturing digital signals and bursts on the TBS2000.
To see the TBS2000 in action, be sure to check out the XYZs of Oscilloscopes Tutorials on the Tektronix YouTube channel.