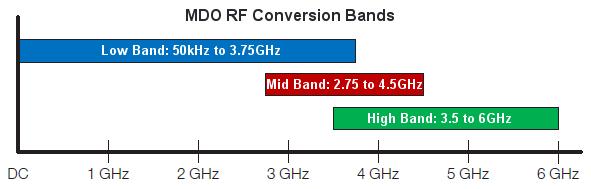
In a previous blog post I discussed the concept of using the RF input on a mixed domain oscilloscope (MDO) as a trigger source for acquisition across analog and digital signals, and provided details about how this trigger source operates. Integral to this was the concept of the RF acquisition bands, or block-conversion, bands. These block-conversion bands are also central to understanding the RF capture bandwidth of the MDO. These bands can be referred to as Low Band, Mid Band, and High Band as shown below.

The user’s selection of center frequency on the spectrum analyzer determines which block-conversion band is used to acquire the RF signal. The MDO automatically selects which band to use in order to maximize the available capture bandwidth around the chosen center frequency.
RF Signal Processing
With the block-conversion band selected, the signals in the selected band are sampled by a 10GHz ADC, and these raw samples are put into memory. These samples then undergo a digital down-conversion (DDC) and filtering process which results in baseband I&Q data that satisfies the user’s frequency span of interest.
The baseband I&Q data of the RF acquisition gives the MDO oscilloscope the ability to compute the spectrum at any location in time within the acquisition and to compute and display the Amplitude, Frequency and Phase vs. time of the RF signal. Finally, the MDO can export the baseband I&Q data for offline analysis with software like Tektronix SignalVu-PC for more complete vector signal analysis.
RF Capture Bandwidth
The DDC and filtering process described above results in I&Q data that’s base-banded about the user’s center frequency. In other words, the frequency span of the I&Q data is “centered” around the center frequency setting on the spectrum analyzer. As a result, the maximum span is limited by how close the center frequency is to either edge of the block-conversion band.
For example, if the user sets the center frequency to 3GHz, and the low-band is used, the maximum bandwidth of the I&Q data will be 1.5GHz. This is because the I&Q data is centered at 3GHz, and the nearest low-band edge is 3.75GHz, which is 750MHz away. Thus, the I&Q data can occupy as much as 1.5GHz, which is 750MHz on either side of 3GHz. The frequency range of the I&Q data is called the capture bandwidth.
While the MDO automatically selects the block-conversion band that provides the most margin, the user may request a narrower frequency span for their analysis, and the DDC/filter process will produce the I&Q data with the appropriate capture bandwidth.
The chart below illustrates the available capture bandwidth range on the RF channel vs. the center frequency that is selected on the spectrum analyzer.

The thick black line represents the maximum I&Q data bandwidth that is symmetric about the center frequency of the spectrum analyzer. Note that this indicates that a minimum of 1GHz capture bandwidth is available for center frequencies between 500MHz and 5.5GHz. The shaded areas of the plot indicate “extra” capture bandwidth that is available to display additional spectrum data on one “side” of the center frequency.
For example, at a center frequency of 1GHz, the symmetric bandwidth of the I&Q data is 2GHz. However, the frequency span can be set to show the full spectrum of the low-band – 50kHz to 3.75GHz.
Why Should You Care?
The capture bandwidth determines the frequency range of signals that can be seamlessly captured vs. time with the MDO’s RF channel. Conventional swept spectrum analyzers typically have a time-domain capture bandwidth of just 10MHz. More sophisticated spectrum/signal analyzers typically have a little more capture bandwidth – 25MHz or 40MHz are typical, while a few offer a little over 100MHz of capture bandwidth. However, this is still a far cry from the 1GHz or more capture bandwidth offered by the MDO’s spectrum analyzer.
The wide capture bandwidth can be very important when characterizing modern devices. Many devices include multiple wireless interfaces, such as WLAN, Bluetooth, multi-band 3G/4G cellular, RFID or NFC communications. Still others may include Zigbee interface, or other frequency agile or frequency/band hopping wireless interfaces. Many of the most common wireless standards in use today, including those mentioned above are below 3GHz. This means that signals in all of these standards can be seamlessly captured over time in the Low Band RF path of the MDO, providing valuable insight to timing relationship of each of these signals with respect to the others.
The wide capture bandwidth of the MDO’s RF channel gives the ability to characterize the “choreography” of these signals over time. For example, it helps to easily understand if problems arise from a simultaneous WLAN, NFC and cellular transmission, such as intermodulation problems, power supply droop, or other issues. Another example is being able to characterize the broadband Electro-Magnetic Interference (EMI) behavior of a device or system under test, and to be able to time correlate the transient RF phenomenon to other analog and digital signals within the device.
Even devices without wireless interfaces can have wideband RF issues to contend with – such as EMI issues, or multiple clock speeds or domains, phase locked loop circuits, spread spectrum clocking systems, etc.
Summary
Understanding the timing relationship of RF signals that may be hundreds of MHz or more apart, and how these signals correlate in time to other analog and digital signals in a device or system, is key to successful development and troubleshooting of many modern devices and systems.
What are some examples of how wideband capture of time-correlated RF signals could be useful in your work? Please add your thoughts, comments and suggestion below.